Market Trader Report V2#21 | JPM, BA, GOOGL & PYPL
MyntBit's Market Trader Report brings potential setups for futures & stocks with a time horizon from days to weeks depending on price action. The following research is based on Fundamentals, Technical & Options Analysis.
What is included in this week's edition?
WEEKLY REVIEW: An overview of current market standing, fundamental matters with implications upon the market, and general sentiment regarding the major US indices.
LOOKING AHEAD: Key takeaways to consider as we look forward to the upcoming trading week.
FUTURES MARKETS: ES, NQ, RTY - A technical review of the major indices, futures, and commodities that represent the overall health of the market.
SPDR SECTORS & ETFs: SPY, QQQ, IWM - An in-depth review of the SPDR sectors with keynotes on market strength, opportunities, and relative rotation.
STOCKS: JPM, BA, GOOGL, PYPL - Trends, key levels, and trade targets are identified for individual names presenting potential opportunities in the market.
Market Trader by MyntBit
Weekly Review
This week was highly successful in the financial markets with positive outcomes across the board. All 11 sectors of the S&P 500, major indices, value stocks, and growth stocks experienced gains. It is not surprising that mega-cap stocks also performed well, with the Vanguard Mega-Cap Growth ETF (MGK) increasing by 2.0%. Importantly, the Invesco S&P 500 Equal-Weight ETF (RSP) outperformed the mega-cap ETF, showing strong interest from a wide range of buyers with a gain of 3.4%.
The month concluded on a positive note as the market-cap weighted S&P 500 reached milestones above 4,200, 4,300, and 4,400 before settling at 4,450 for the quarter. The Nasdaq Composite had its best first-half performance since 1983, achieving a gain of 31.7%.
The week was eventful, featuring a reported coup attempt in Russia that ended quickly, encouraging economic data including May Durable Goods Orders, June Consumer Confidence, May New Home Sales, Weekly Initial Jobless Claims, an upward revision to Q1 GDP, and May Personal Income and Spending. There were also reminders from Fed Chair Powell, ECB President Lagarde, and BoE Governor Bailey that inflation may require further tightening measures. Additionally, there were IPOs and the release of the Federal Reserve's annual bank stress test results, with all 23 banks passing. Earnings results were mixed from companies such as Carnival Corp. (CCL), Walgreens Boots Alliance (WBA), General Mills (GIS), Micron (MU), and Nike (NKE).
Throughout these events, there was a steadfast belief that the U.S. economy could avoid a recession and that the Federal Reserve was nearing the end of its rate hikes, which drove broad-based buying interest.
In terms of sectors, countercyclical consumer staples, healthcare, and utilities performed relatively poorly, while communication services experienced pressure due to Alphabet's (GOOG) 1.7% decline after downgrades from UBS and Bernstein. Real estate and energy were the top-performing sectors of the week, followed by materials, industrials, financials, information technology, and consumer discretionary.
In the Treasury market, there were fluctuations due to new supply and potential asset reallocation trades driven by the stock market's bullish behavior. The 2-year note yield increased by 13 basis points to 4.88%, while the 10-year note yield rose eight basis points to 3.82%.
Lastly, a reminder was given about early market closures at 1:00 p.m. ET on July 3 in observance of Independence Day, with markets closed on Tuesday, July 4.
Weekly Performance Heatmap
Overall Stock Market Heatmap
Sector Performance
Looking Ahead
The main events to watch during the shortened week will be the release of the June jobs report and the Federal Open Market Committee's meeting minutes from June 14th. Investors will also receive updates on the labor market through June's ADP employment change and May's JOLTS job openings.
Additionally, the Institute of Supply Management will provide June's purchasing managers' index (PMI) readings for manufacturing and services, while S&P Global will release the finalized June manufacturing reading. Other notable releases include May's factory orders, construction spending, trade balance, and finalized durable goods orders.
In Asia, investors will be paying attention to the Caixin China manufacturing PMI for insights into the private sector's conditions in June. Japan will release the finalized Jibun Bank manufacturing PMI for May and the second quarter Tankan Manufacturing Index. The Reserve Bank of Australia will hold a policy meeting, and Australian data releases will include June's Melbourne Institute inflation gauge and May's building approvals and trade balance. South Korea will provide updates on the June Consumer Price Index and S&P Global manufacturing PMI.
In Europe, the highlights will be the release of June's finalized manufacturing, services, and composite PMIs for the Eurozone, as well as individual measures for Germany, France, and the U.K. Other releases of importance include May's Producer Price Index and retail sales for the Eurozone, along with German factory orders and industrial production data for Germany and France in May.
Earnings Calendar
Economical Events
Future & Commodities Markets
Below are the levels for the upcoming week - updates will be provided on Twitter throughout the week.
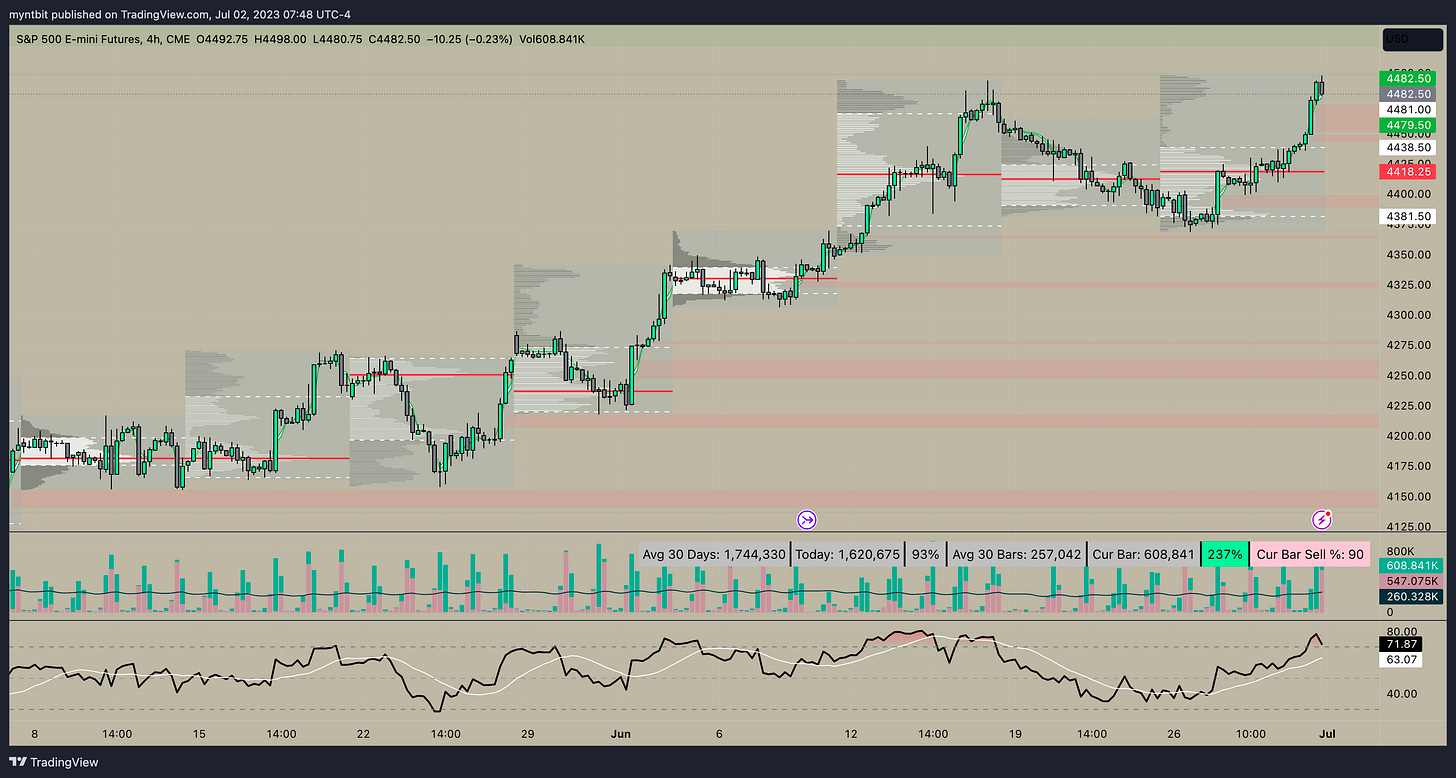
/ES - Emini S&P 500
🐂 Upside: If the 4460 level is maintained this could encourage an upward move towards 4500. If there is a breakthrough above this level, the target could be set at 4530. 4460 is a key test of support for bulls for further upside.
🐻 Downside: If the position above 4460 cannot be sustained, there is a chance of revisiting and testing the 4430 level. Failing to hold that as support could lead to a further test of 4410-4400. 4400 should act as a key support.
Options Analysis
Volume: the volume for the upcoming week's expiry is 447,247 puts vs 173,885 calls suggesting a bearish sentiment.
Open Interest: the option interest for the upcoming week's expiry is 349,525 puts vs 130,070 calls again confirming a bearish sentiment.
Expected Move: Above OI & Vol suggested a bearish sentiment and the expected move for the upcoming week is listed below.
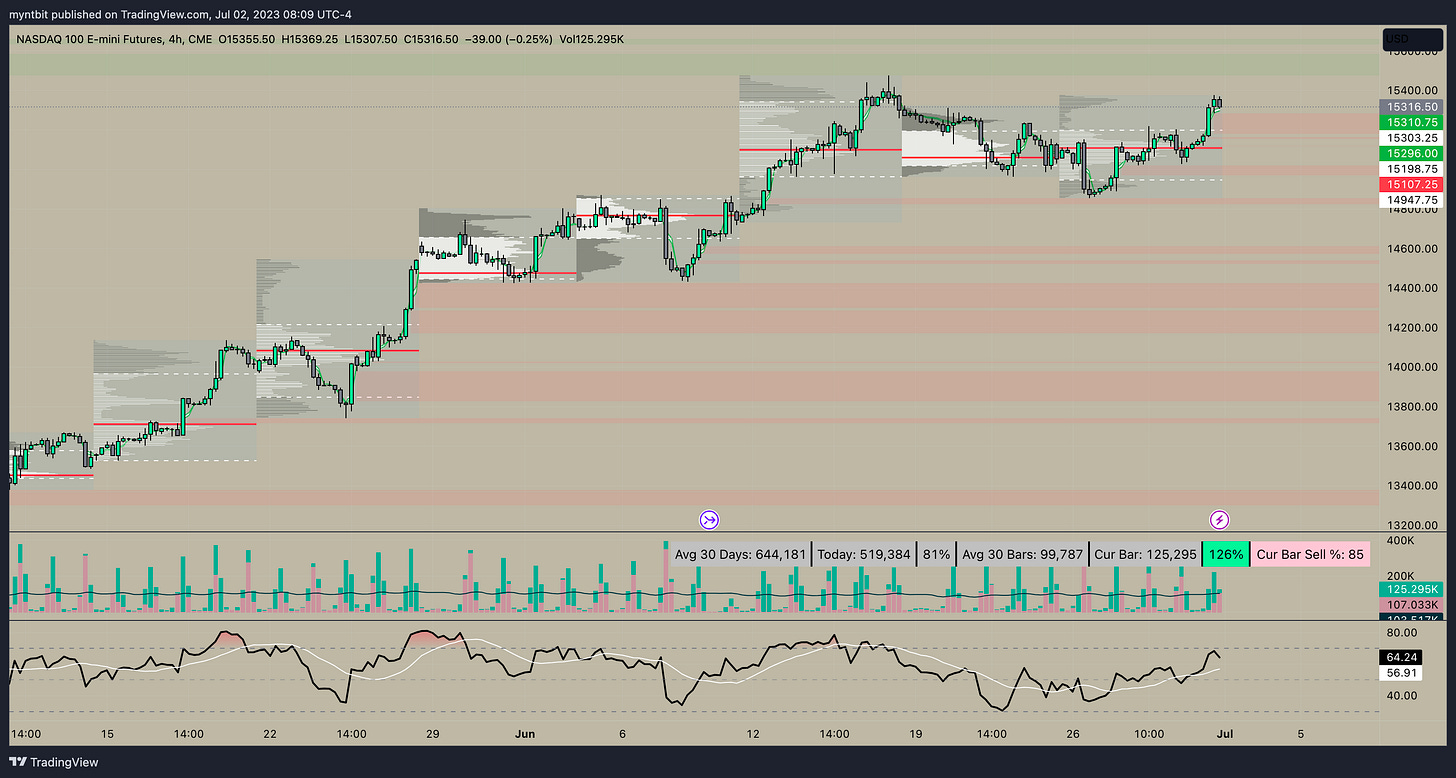
/NQ - Emini Nasdaq 100
🐂 Upside: If we are able to maintain a position above the 15250 level, there is a possibility of testing the 15375 mark. If we successfully surpass this level, it may result in additional gains, with the next resistance level identified at 15500.
🐻 Downside: If the price fails to stay above 15250, it may decline toward the 15100 mark. If it breaks below this level, it would trigger a test of the significant support level at 14950-15050.
Options Analysis
Volume: the volume for the upcoming week's expiry is 7,555 puts vs 9,368 calls suggesting a slightly bullish sentiment.
Open Interest: the option interest for EOM expiry (June 30th) is 12,221 puts vs 5,367 calls a slightly bullish sentiment.
Expected Move: Above OI & Vol suggested a mixed sentiment and the expected move for the upcoming week is listed below.
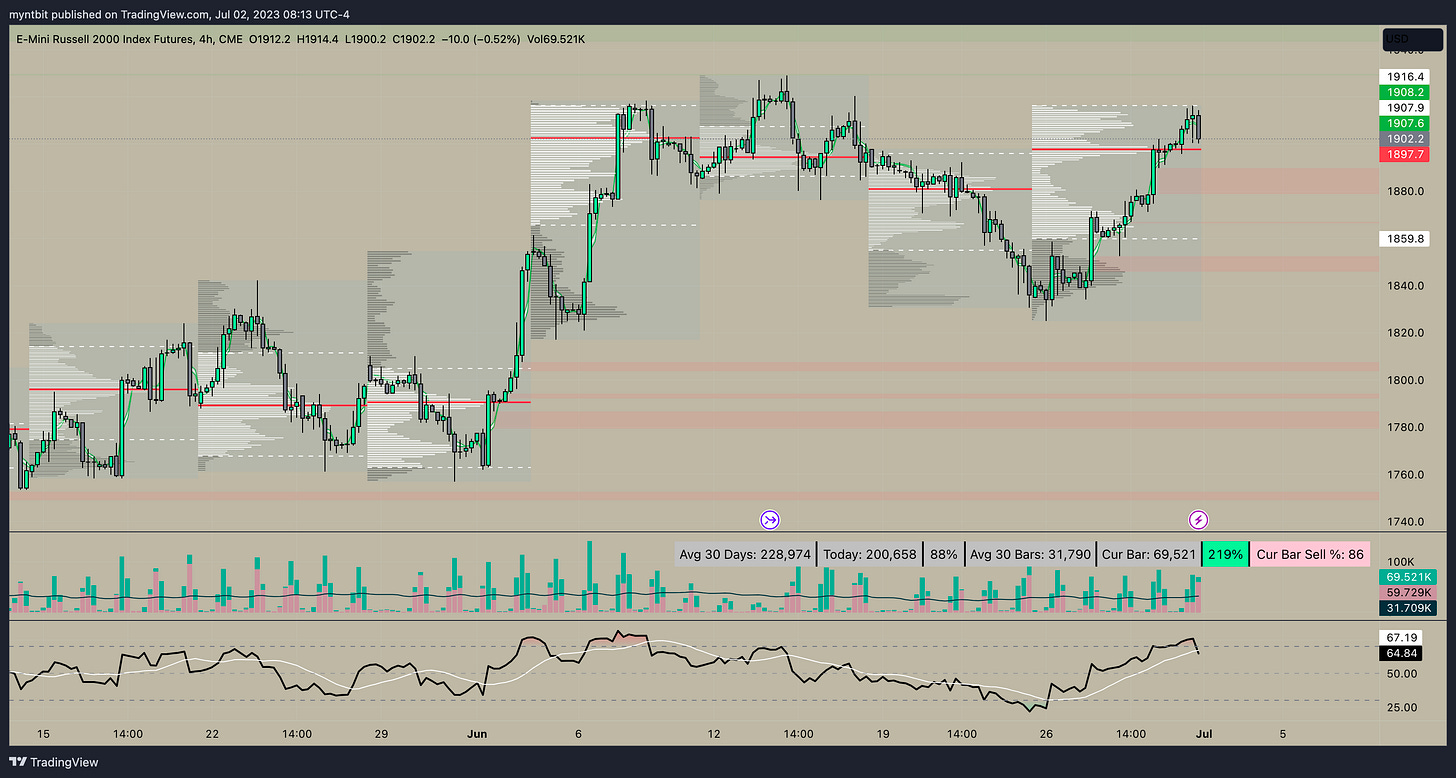
/RTY - Emini Russell 2000
🐂 Upside: In case the price remains above 1900, there is a possibility of testing 1916 which is a significant level but if we manage to break above that the next level is 1930.
🐻 Downside: However, if the price falls below 1900, it could lead to a decline toward 1870 and then a possible test of a critical support level at 1850.
Options Analysis
Volume: the volume for the upcoming week's expiry is 293 puts vs 561 calls suggesting a bullish sentiment on low volume.
Open Interest: the option interest for the upcoming week's expiry is 394 puts vs 1,981 calls is bullish sentiment.
Expected Move: Above OI & Vol suggested a bullish sentiment and the expected move for the upcoming week is listed below
Follow us on Twitter!
Updates will be provided on Twitter throughout the week (link is below)
SPDR Sectors & ETFs
SPY - S&P 500 ETF
🐂 Upside: In case the price remains above 440, there is a possibility of testing 444 which is a significant level but if we manage to break above that the next level is 447. 444 has been a critical level of resistance
🐻 Downside: However, if the price falls below 440, it could lead to a decline toward 438 and then a possible test of a critical support level at 435. 438 has a gap on the downside on SPY
Options Analysis
Volume: the volume for the upcoming week's expiry is 1,314,329 puts vs 1,213,517 calls suggesting a bearish sentiment.
Open Interest: the option interest for the upcoming week's expiry is 754,722 puts vs 436,143 calls again confirming a bearish sentiment.
Expected Move: Above OI & Vol suggested a bearish sentiment and the expected move for the upcoming week is listed below
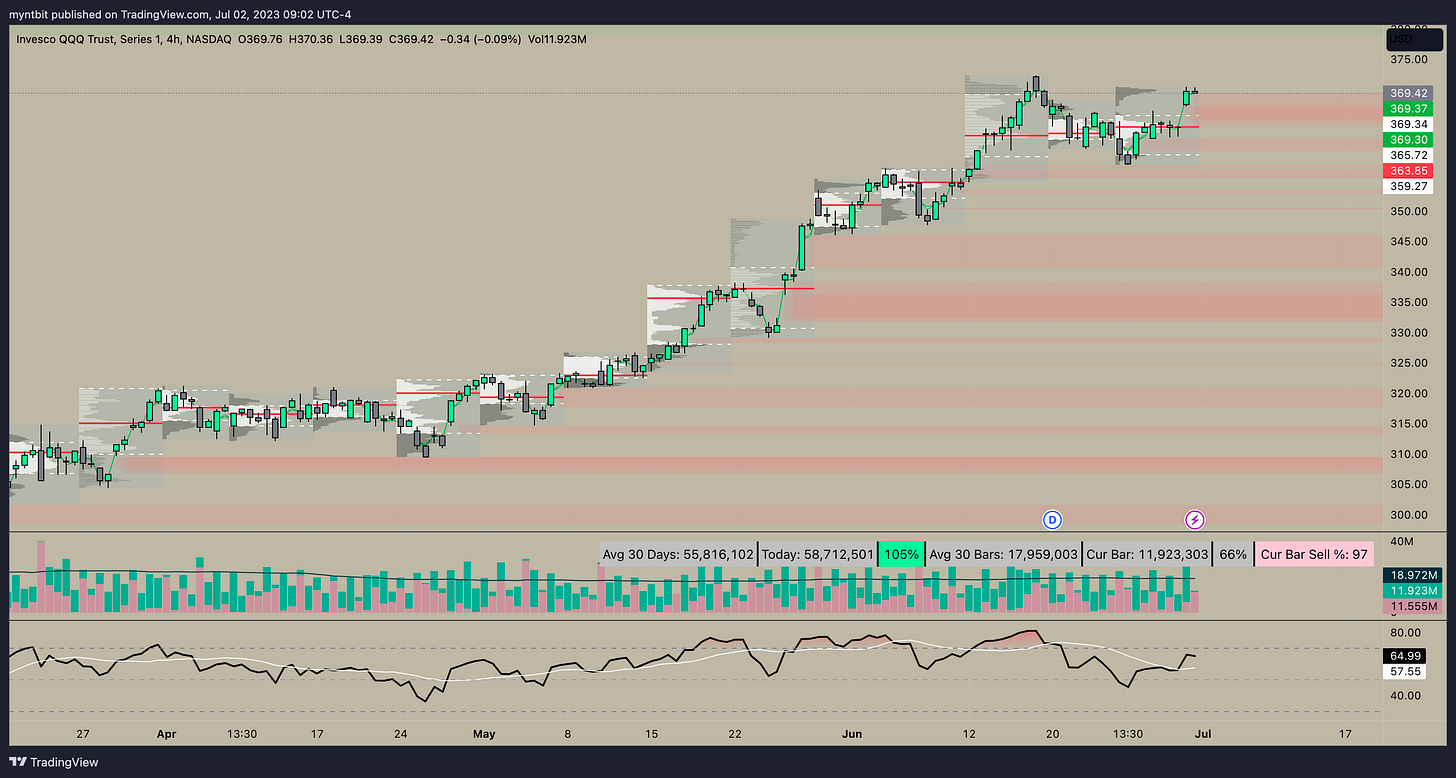
QQQ - Nasdaq 100 ETF
🐂 Upside: In case the price remains above 368, there is a possibility of testing 371-372 which is a significant level but if we manage to break above that the next level is 375.
🐻 Downside: However, if the price falls below 368, it could lead to a decline toward 365-364 and then a possible test of a critical support level at 360. 364 would be a gap fill
Options Analysis
Volume: the volume for the upcoming week's expiry is 448,523 puts vs 381,228 calls suggesting a bearish sentiment.
Open Interest: the option interest for the upcoming week's expiry is 531,196 puts vs 238,868 calls again confirming a bearish sentiment.
Expected Move: Above OI & Vol suggested a bearish sentiment and the expected move for the upcoming week is listed below
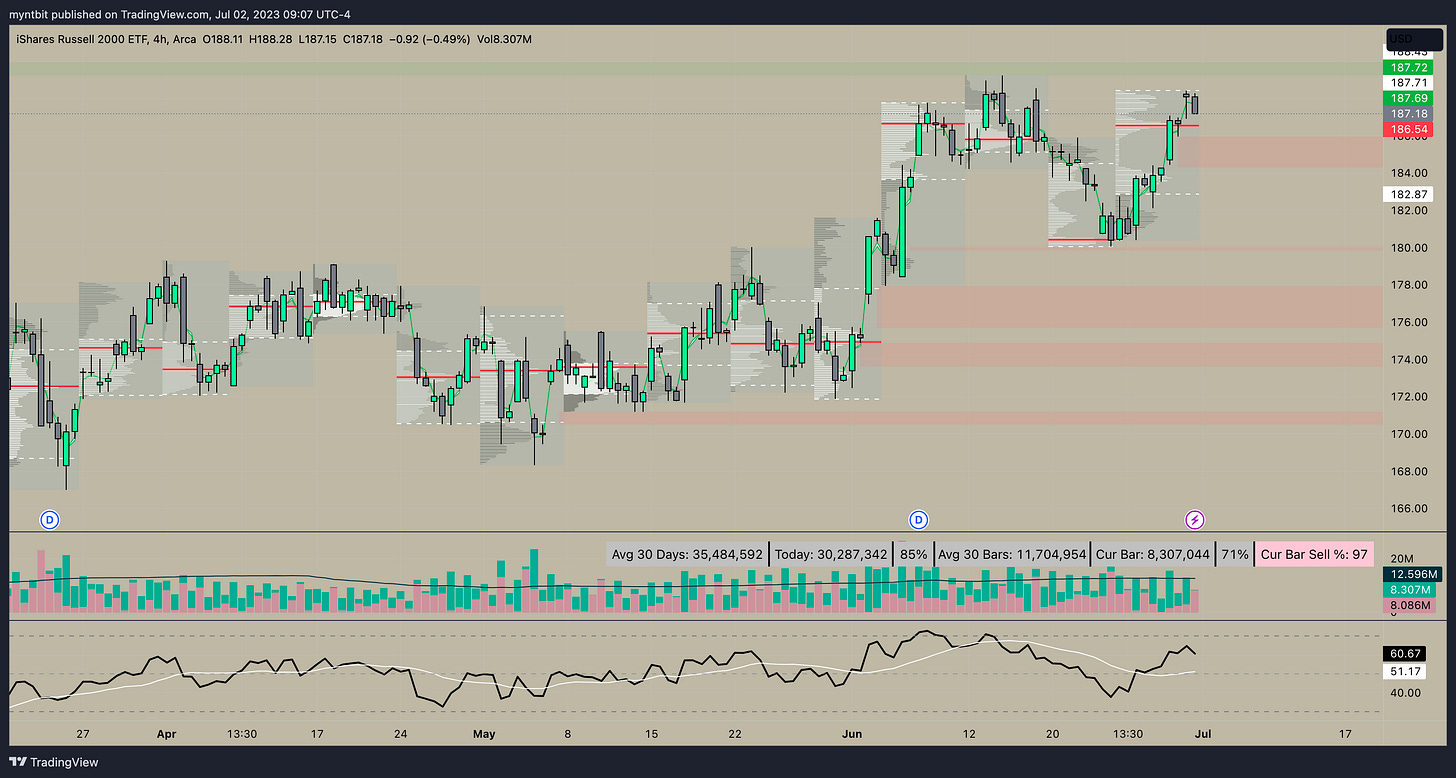
IWM - Russell 2000 ETF
🐂 Upside: In case the price remains above 186.50, there is a possibility of testing 188.50 which is a significant level but if we manage to break above that the next level is 190.
🐻 Downside: However, if the price falls below 186.50, it could lead to a decline toward 185-184 and then a possible test of a critical support level at 182.50.
Options Analysis
Volume: the volume for the upcoming week's expiry is 66,768 puts vs 200,344 calls suggesting a bullish sentiment.
Open Interest: the option interest for the upcoming week's expiry is 101,809 puts vs 135,485 calls again confirming a bullish sentiment.
Expected Move: Above OI & Vol suggested a bullish sentiment and the expected move for the upcoming week is listed below
Stocks
JPM - JPMorgan Chase & Co.
🐂 Upside: if the current price holds above 144 it could target 148 with an upside target at 153
🐻 Downside: if it breaks below 144, it will go down to 141 and it could also go down to close the gap at 138
JPM just broke above April 2022 high of 144. This area of 141 till 145 has been critical levels since pre-covid.
Analyst Ratings
Options Analysis
Volume: the volume for weekly expiry till Jul 21 is 22,963 puts vs 72,211 calls suggesting a bullish position.
Open Interest: the option interest for weekly expiry till Jul 21 is 128,969 puts vs 207,221 calls suggesting a bullish sentiment.
Expected Move: the expected move for the upcoming week and the next few weeks are listed below.
BA - Boeing Co.
🐂 Upside: If this stays above 213 then it could go up to 215 with 219 being a critical resistance then the next stop will be the range top at 224.
🐻 Downside: If it break below 213-211 area then the next stop will be 208 with 200 acting a critical support.
BA is currently range bound between 194 to 224, until one of those levels break - long the bottom/short the top.
Analyst Ratings
Options Analysis
Volume: the volume for weekly expiry till Jul 21 is 11,591 puts vs 29,331 calls suggesting a bullish position.
Open Interest: the option interest for weekly expiry till Jul 21 is 46,418 puts vs 85,376 calls suggesting a bullish sentiment.
Expected Move: the expected move for the upcoming week and the next few weeks are listed below.
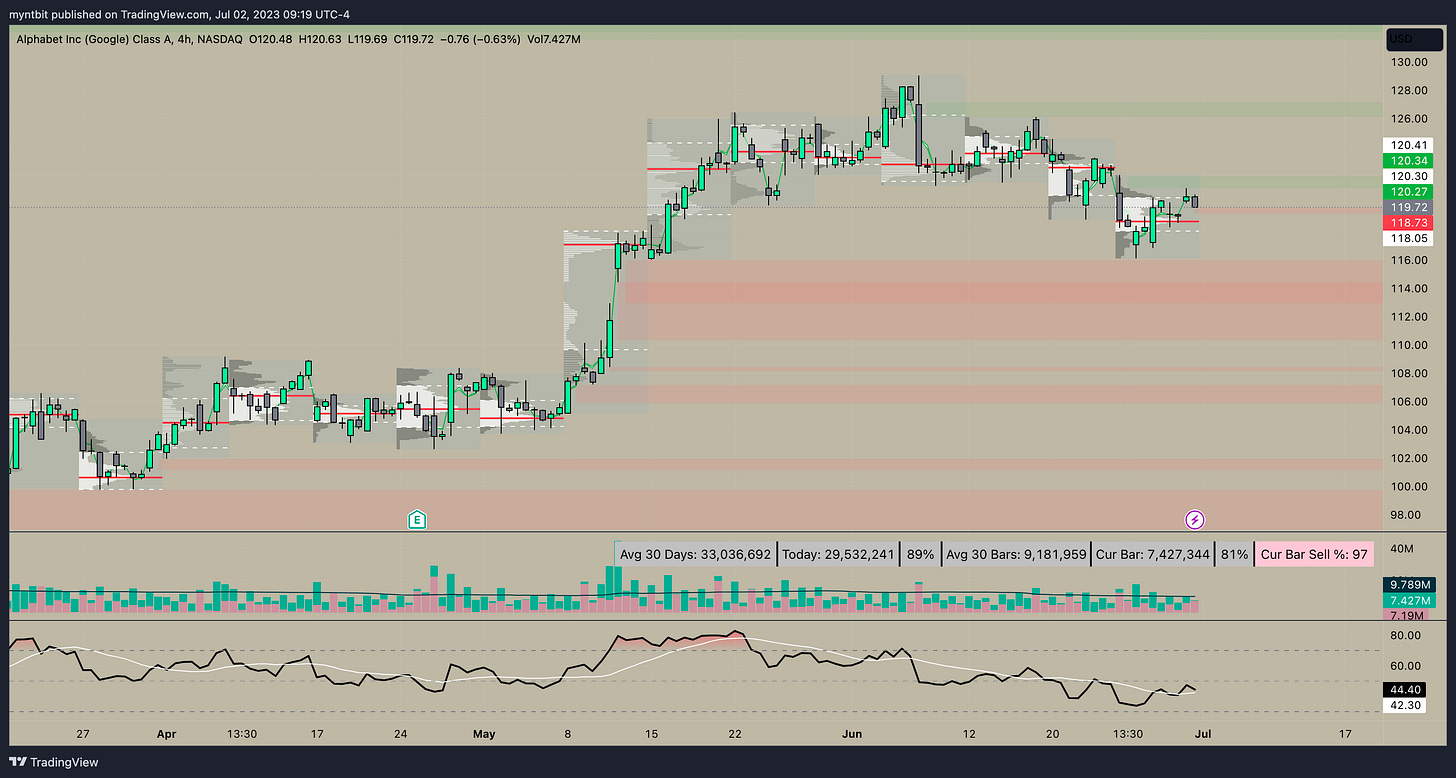
GOOGL - Alphabet Inc.
🐂 Upside: If the price hold 118 then the next target is above 122.68 to test 124.50
🐻 Downside: If the price can't hold the current level and 118 the next targets are 116.02, 114.28, and 109.60. 113 will be a gap close
Analyst Ratings
Options Analysis
Volume: the volume for weekly expiry till Jul 21 is 33,397 puts vs 126,179 calls suggesting a bullish position.
Open Interest: the option interest for weekly expiry till Jul 21 is 216,016 puts vs 282,670 calls suggesting a bullish sentiment.
Expected Move: the expected move for the upcoming week and the next few weeks are listed below.
PYPL - PayPal Holdings, Inc.
🐂 Upside: If the price re-test the 59-61 area would probably offer a good buying opportunity with a price target would be $70, 72,74, and possibly $80.
🐻 Downside: If the price can't hold the current level at 67 then the next targets are 65.96, 65, and 64.20.
PYPL might be the most undervalued NASDAQ stock.The company entered into an exclusive multi-year relationship with KKR and announced plans to allocate approximately $1 billion to share repurchases this year. PayPal said it will allocate approximately $1 billion to incremental share repurchases this year, which will contribute to approximately $5 billion in total share repurchases in 2023.
Recent news related to the company are below:
https://www.benzinga.com/23/06/32928261/american-payment-companies-paralyzed-by-regulatory-concerns-international-payment-companies-take-adv
additionally, Paypal will also face competition at an infrastructure level due to FedNow payments system.
https://www.forbes.com/advisor/personal-finance/fednow-faqs/
Analyst Ratings
Options Analysis
Volume: the volume for weekly expiry till Jul 21 is 17,432 puts vs 63,021 calls suggesting a bullish position.
Open Interest: the option interest for weekly expiry till Jul 21 is 102,942 puts vs 206,676 calls suggesting a bullish sentiment.
Expected Move: the expected move for the upcoming week and the next few weeks are listed below.
Disclaimer: This newsletter is not trading or investment advice, but for general informational purposes only. This newsletter represents our personal opinions that we share publicly for educational purposes. Futures, stocks, and bonds trading of any kind involves a lot of risks. No guarantee of any profit whatsoever is made. In fact, you may lose everything you have. So be very careful. We guarantee no profit whatsoever, You assume the entire cost and risk of any trading or investing activities you choose to undertake. You are solely responsible for making your own investment decisions. Owners/authors of this newsletter, its representatives, its principals, its moderators, and its members, are NOT registered as securities broker-dealers or investment advisors either with the U.S. Securities and Exchange Commission, CFTC, or with any other securities/regulatory authority. Consult with a registered investment advisor, broker-dealer, and/or financial advisor. By reading and using this newsletter or any of my publications, you are agreeing to these terms. Any screenshots used here are courtesy of ForexFactory, EarningsWishper, Finviz, ThinkorSwim, and/or Tradingview. We are just end-users with no affiliations with them.


