Weekly Report | Aug 04, 2024 + AAPL, GOOGL, ONON
What is included in this week's edition?
WEEKLY REVIEW: An overview of current market standing, fundamental matters with implications upon the market, and general sentiment regarding the major US indices.
LOOKING AHEAD: Key takeaways to consider as we look forward to the upcoming trading week.
MARKETS: A technical review of the major indices and commodities that represent the overall health of the market.
Market Trader by MyntBit | Issue# 30
Stocks experienced another volatile week as the Federal Reserve (Fed) left rates unchanged, and economic data raised concerns of a potential sharp slowdown, leading to a market sell-off and declining Treasury yields. Key data releases fueling these concerns included the Institute for Supply Management (ISM) Purchasing Managers’ Index (PMI) for manufacturing, which indicated activity nearing its lowest levels in nearly three years. Additionally, Friday’s jobs report highlighted a significant slowdown in hiring and the steepest increase in the unemployment rate in almost three years. Initial jobless claims also reached their highest levels in nearly a year.
Other factors contributing to the risk-off sentiment included disappointing earnings reports, election uncertainty, and geopolitical tensions.
Overall Stock Market Heatmap
Sector Performance
Looking Ahead to the Upcoming Week
Next week is expected to be lighter on data, with investors focusing on ISM’s services PMI and consumer credit. Meanwhile, the earnings season will begin to wind down.
Economic Events
Earnings Event
Markets
Below are the levels for the upcoming week - updates will be provided on X (previously Twitter) throughout the week.
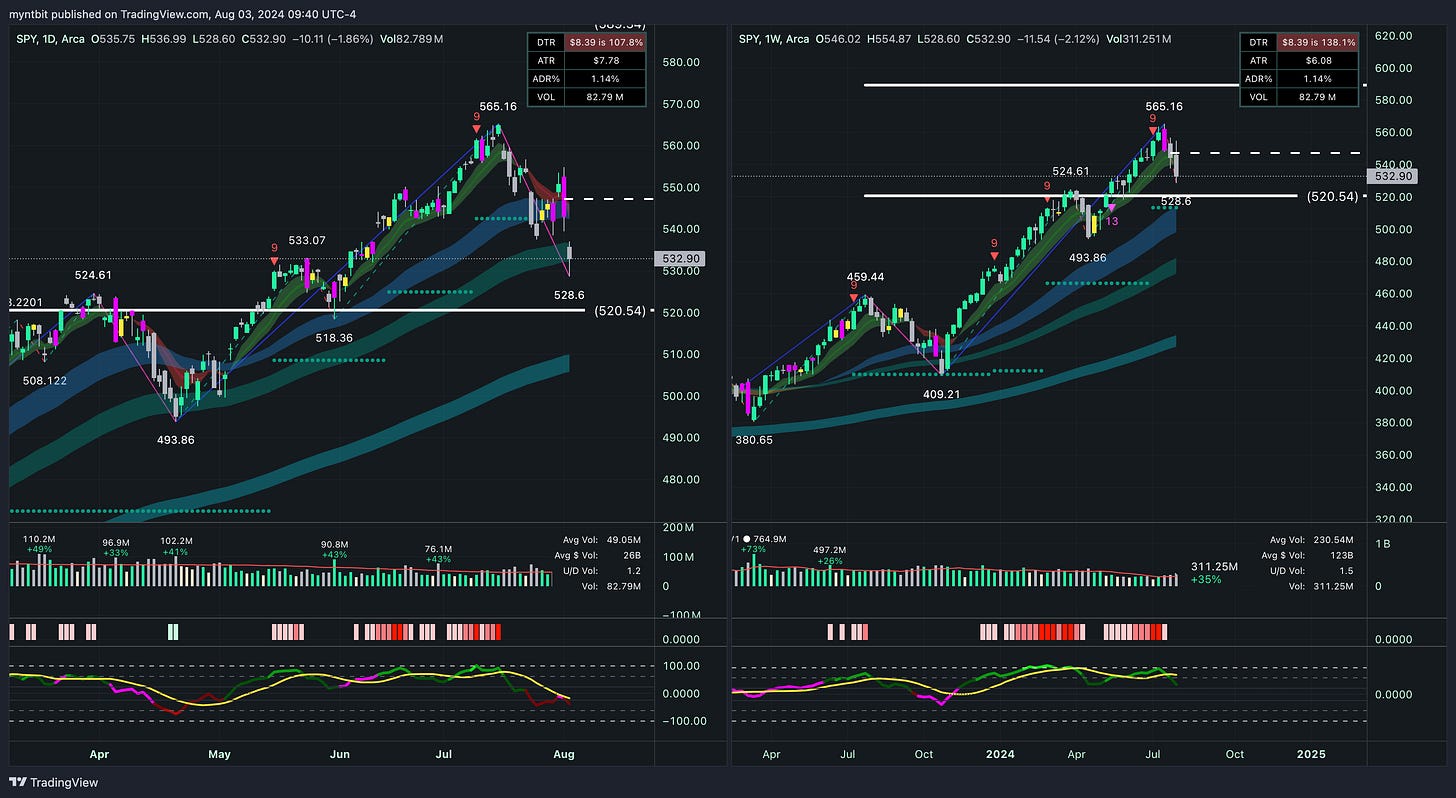
SPY - SPDR S&P 500 ETF Trust
Bullish Case:
A bounce from the support level at 528.6 could push the stock towards the next resistance at 540.00 and potentially higher to 550.00. The significant volume increase suggests strong buying interest at these levels.
Bearish Case:
A failure to hold the 528.6 support level could lead to a decline towards the stronger support level at 520.54. The high volatility indicated by the ATR suggests potential for larger price swings.
Trend
Short Term (1-2 weeks): Neutral to Bearish. The stock is currently testing key support levels, and failure to hold 528.6 could lead to further downside.
Medium Term (1-3 months): Neutral. The stock needs to break above 540.00 to confirm a medium-term uptrend towards 550.00.
Long Term (3+ months): Bullish. The long-term trend remains upward unless the stock breaks significantly below the key support level of 520.54.
QQQ - Invesco QQQ Trust Series 1
Bullish Case:
A bounce from the support level at 444.47 could push the stock towards the next resistance at 460.58 and potentially higher to 476.07. The significant volume increase suggests strong interest in this support level.
Bearish Case:
A failure to hold the 444.47 support level could lead to a decline towards the stronger support level at 432.74. The high volatility indicated by the ATR suggests potential for larger price swings.
Trend
Short Term (1-2 weeks): Neutral to Bearish. The stock is currently testing key support levels, and failure to hold 444.47 could lead to further downside.
Medium Term (1-3 months): Neutral. The stock needs to break above 460.58 to confirm a medium-term uptrend towards 476.07.
Long Term (3+ months): Bullish. The long-term trend remains upward unless the stock breaks significantly below the key support level of 432.74.
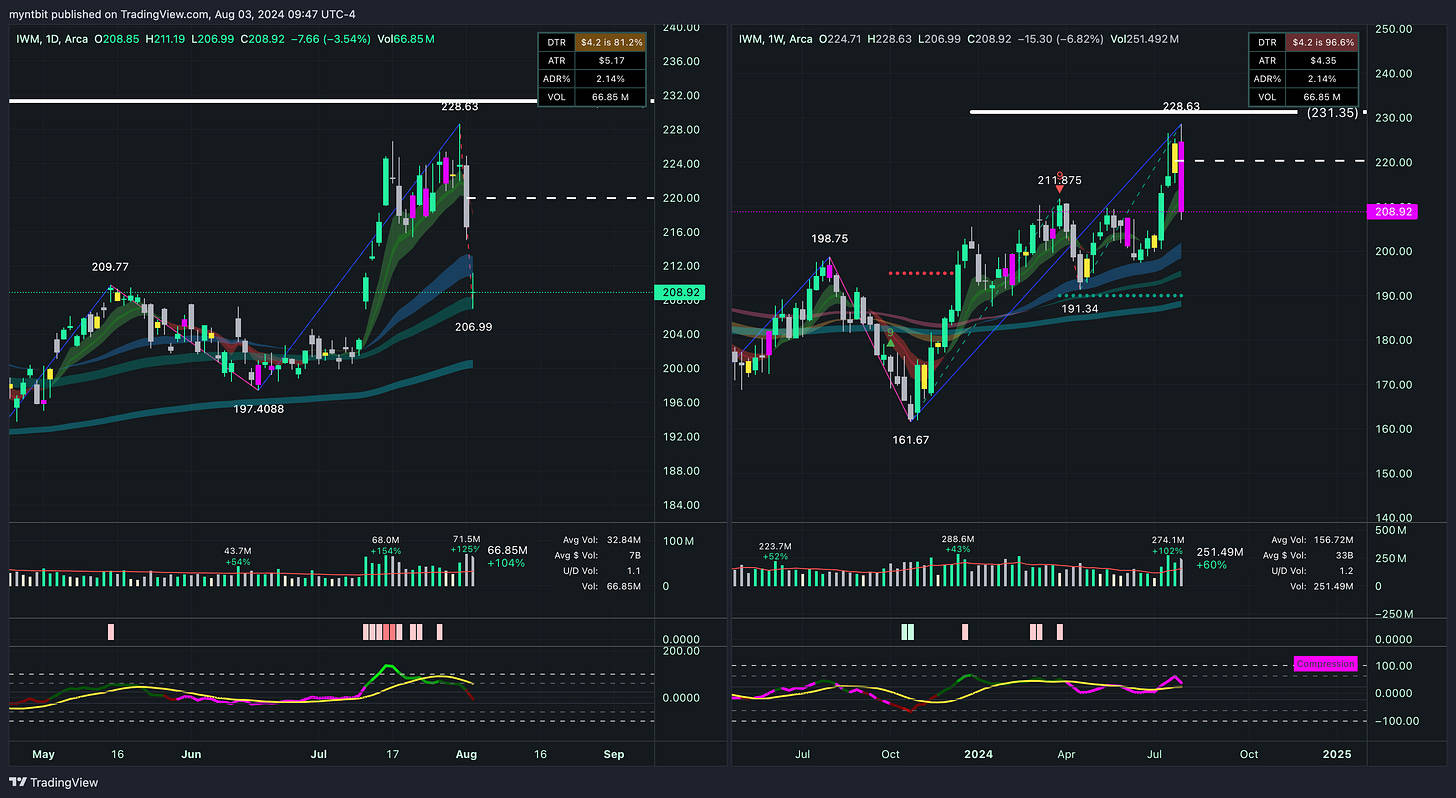
IWM - iShares Russell 2000 ETF
Bullish Case:
A bounce from the support level at 206.99 could push the stock towards the next resistance at 211.87 and potentially higher to 228.63. The significant volume increase suggests strong interest in this support level.
Bearish Case:
A failure to hold the 206.99 support level could lead to a decline towards the stronger support level at 197.41. The high volatility indicated by the ATR suggests potential for larger price swings.
Trend
Short Term (1-2 weeks): Neutral to Bearish. The stock is currently testing key support levels, and failure to hold 206.99 could lead to further downside.
Medium Term (1-3 months): Neutral. The stock needs to break above 211.87 to confirm a medium-term uptrend towards 228.63.
Long Term (3+ months): Bullish. The long-term trend remains upward unless the stock breaks significantly below the key support level of 197.41.
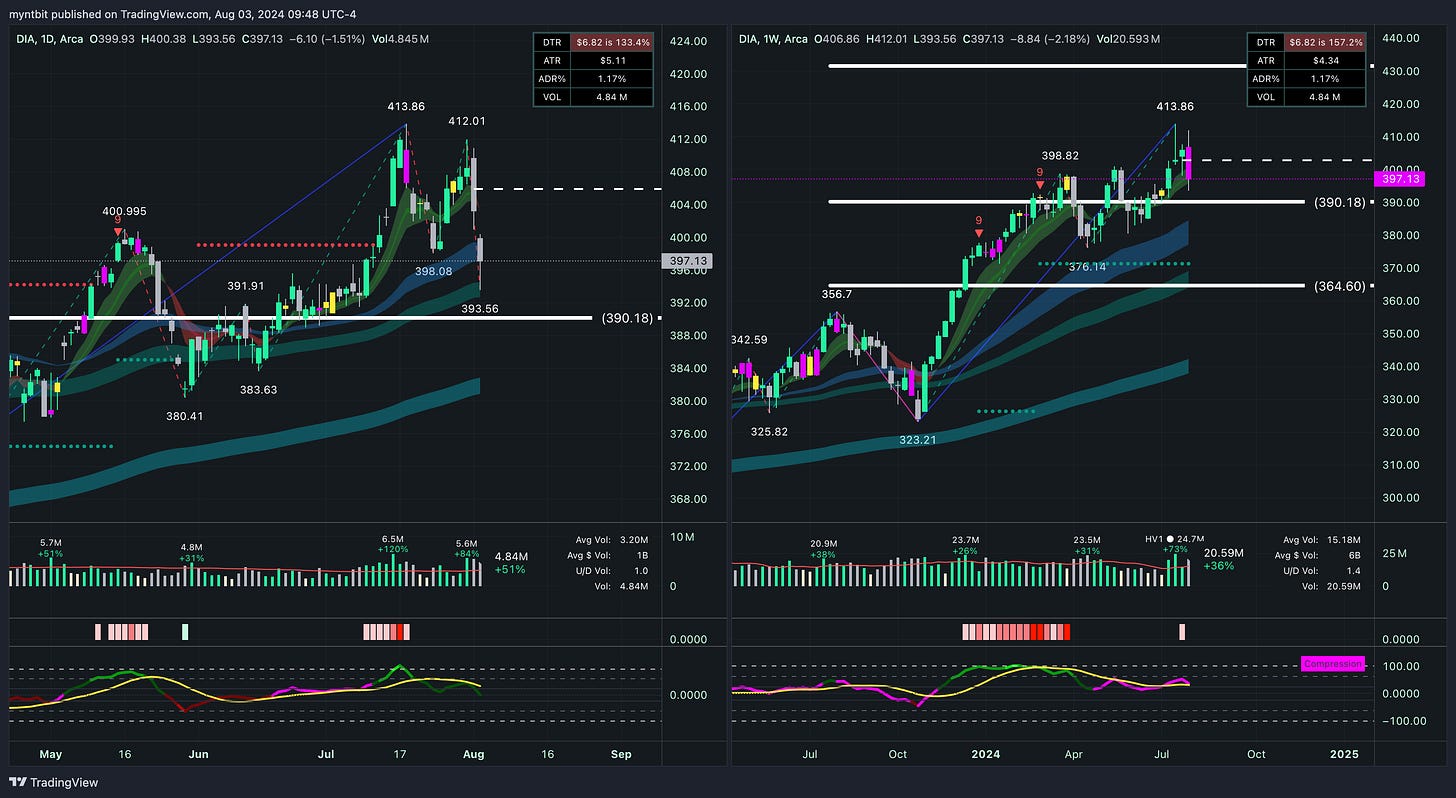
DIA - SPDR Dow Jones Industrial Average ETF Trust
Bullish Case:
A bounce from the support level at 393.56 could push the stock towards the next resistance at 398.08 and potentially higher to 412.01. The significant volume increase suggests strong interest in this support level.
Bearish Case:
A failure to hold the 393.56 support level could lead to a decline towards the stronger support level at 390.18. The high volatility indicated by the ATR suggests potential for larger price swings.
Trend
Short Term (1-2 weeks): Neutral to Bearish. The stock is currently testing key support levels, and failure to hold 393.56 could lead to further downside.
Medium Term (1-3 months): Neutral. The stock needs to break above 398.08 to confirm a medium-term uptrend towards 412.01.
Long Term (3+ months): Bullish. The long-term trend remains upward unless the stock breaks significantly below the key support level of 390.18.
VIX - Volatility S&P 500 Index
Bullish Case:
If the VIX continues to rise, it could indicate increasing fear and volatility in the market, possibly pushing the index towards higher resistance levels, potentially even surpassing 29.66 if the market turmoil intensifies.
Bearish Case:
A quick drop from these high levels could indicate a short-lived spike, with the VIX possibly settling back to support levels around 18.88 or 21.36 as market conditions stabilize.
Trend
Short Term (1-2 weeks): Bullish. The sharp spike suggests that market volatility is currently very high and could remain elevated in the short term.
Medium Term (1-3 months): Neutral to Bearish. The VIX might settle down after the initial shock, reverting to its mean levels around 18-20 if market conditions stabilize.
Long Term (3+ months): Bearish. Historically, such sharp increases in the VIX are often followed by a gradual decline as market conditions normalize.
Last Week's Watchlist
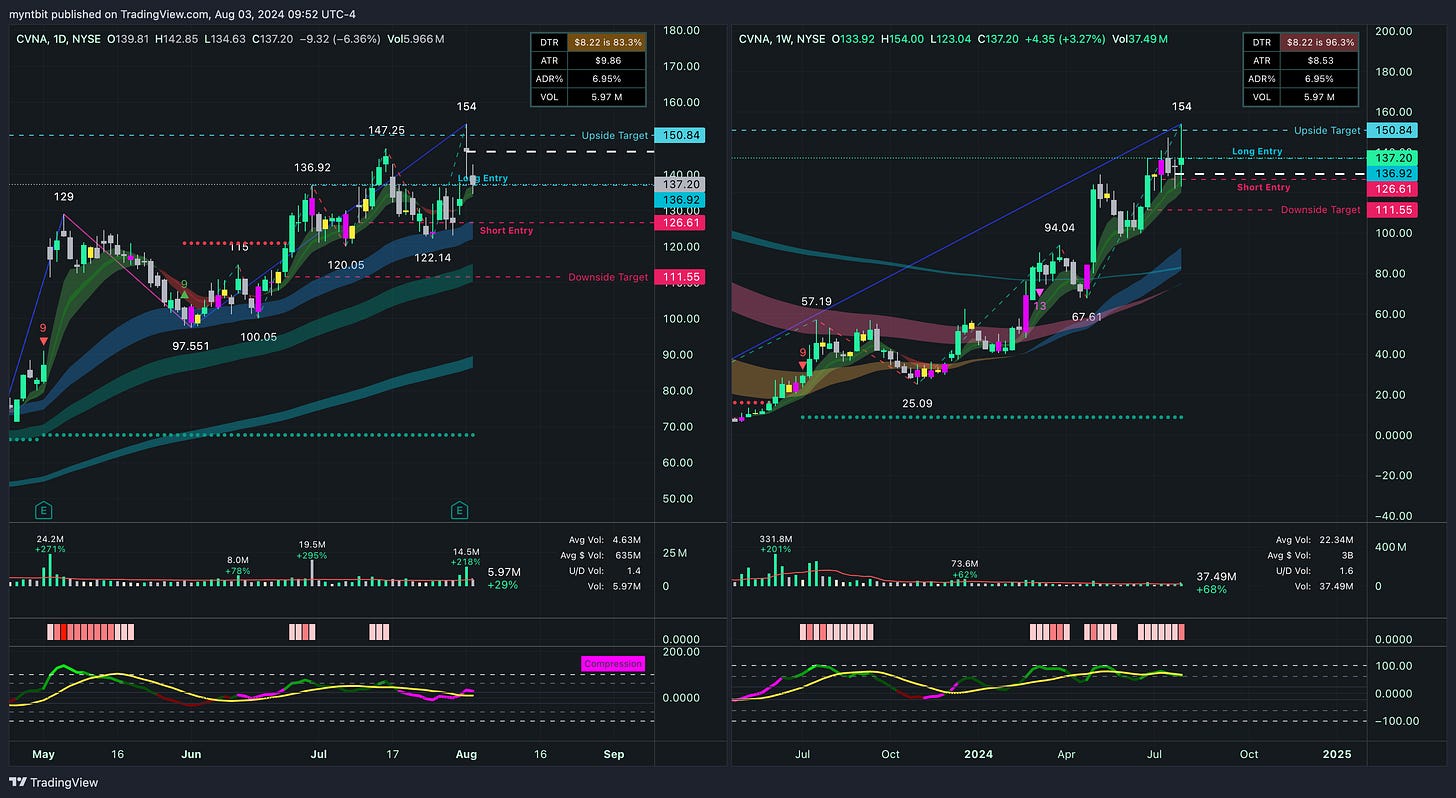
CVNA - Carvana Co.
CVNA hit the upside target after their earnings. This will be removed from the list.
MRNA - Moderna, Inc.
MRNA hit the downside target after their earnings. This will be removed from the list.
CHWY - Chewy, Inc.
CHWY finally hit the downside target. This will be removed from the list.
CRM - Salesforce, Inc.
CRM broke below the Short Entry level. The target remains the same.
Bullish Case:
A break above 265.81 could push the stock towards the next resistance at 290.02. The significant increase in price suggests a continuation of the bullish trend in the short term.
Bearish Case:
A failure to hold the 245.17 support level could lead to a decline towards the stronger support level at 227.77.
ENPH - Enphase Energy, Inc.
ENPH broke below the Short Entry level and came close to the downside target. This will be removed from the list.
ORCL - Oracle Co.
ORCL broke below the Short Entry level. The target remains the same.
Bullish Case:
A break above 143.11 could push the stock towards the next resistance at 150.05. The significant recovery from lower levels suggests the potential for a continuation of the bullish trend in the short term.
Bearish Case:
A failure to hold the 137.202 support level could lead to a decline towards the stronger support level at 133.96 and possibly further down to 124.80.
Stock Watchlist for the Upcoming Week
AAPL - Apple Inc. (Freebie)
Bullish Case:
AAPL has shown resilience with a strong bounce from the support level of 214.62.
If the stock breaks above 225.60, it could retest the 232.33 level and potentially move towards the previous high of 237.23.
The high volume on the daily chart suggests strong buying interest.
Bearish Case:
If AAPL fails to hold above 219.86, it could retest the support levels at 214.62 and 206.59.
A break below 206.59 would indicate a more significant correction, potentially leading to further downside.
Options Opportunity
Call Option: Consider buying a call option with a strike price around 225, expiring in 1-2 months, to capitalize on the expected upward move.
Put Option: As a hedge, a put option with a strike price around 210, expiring in 1-2 months, could protect against a potential downside move if the stock fails to hold above support levels.
Keep reading with a 7-day free trial
Subscribe to BitResearch by MyntBit to keep reading this post and get 7 days of free access to the full post archives.


