Weekly Report | Aug 18, 2024 + MSTR, ABNB, GOOGL
What is included in this week's edition?
WEEKLY REVIEW: An overview of current market standing, fundamental matters with implications upon the market, and general sentiment regarding the major US indices.
LOOKING AHEAD: Key takeaways to consider as we look forward to the upcoming trading week.
MARKETS: A technical review of the major indices and commodities that represent the overall health of the market.
Market Trader by MyntBit | Issue# 31
This week’s economic data bolstered a recovery in stocks as both Consumer and Producer Price Index (CPI and PPI) inflation mostly met consensus expectations, while retail sales exceeded forecasts. Alongside other positive indicators, including improved consumer sentiment and small business optimism, market expectations for a rate cut in September remained intact, though the number of anticipated cuts by year-end moderated from recently elevated levels. However, these encouraging data points were contrasted by continued uncertainty and caution in the manufacturing sector and housing market.
Overall Stock Market Heatmap
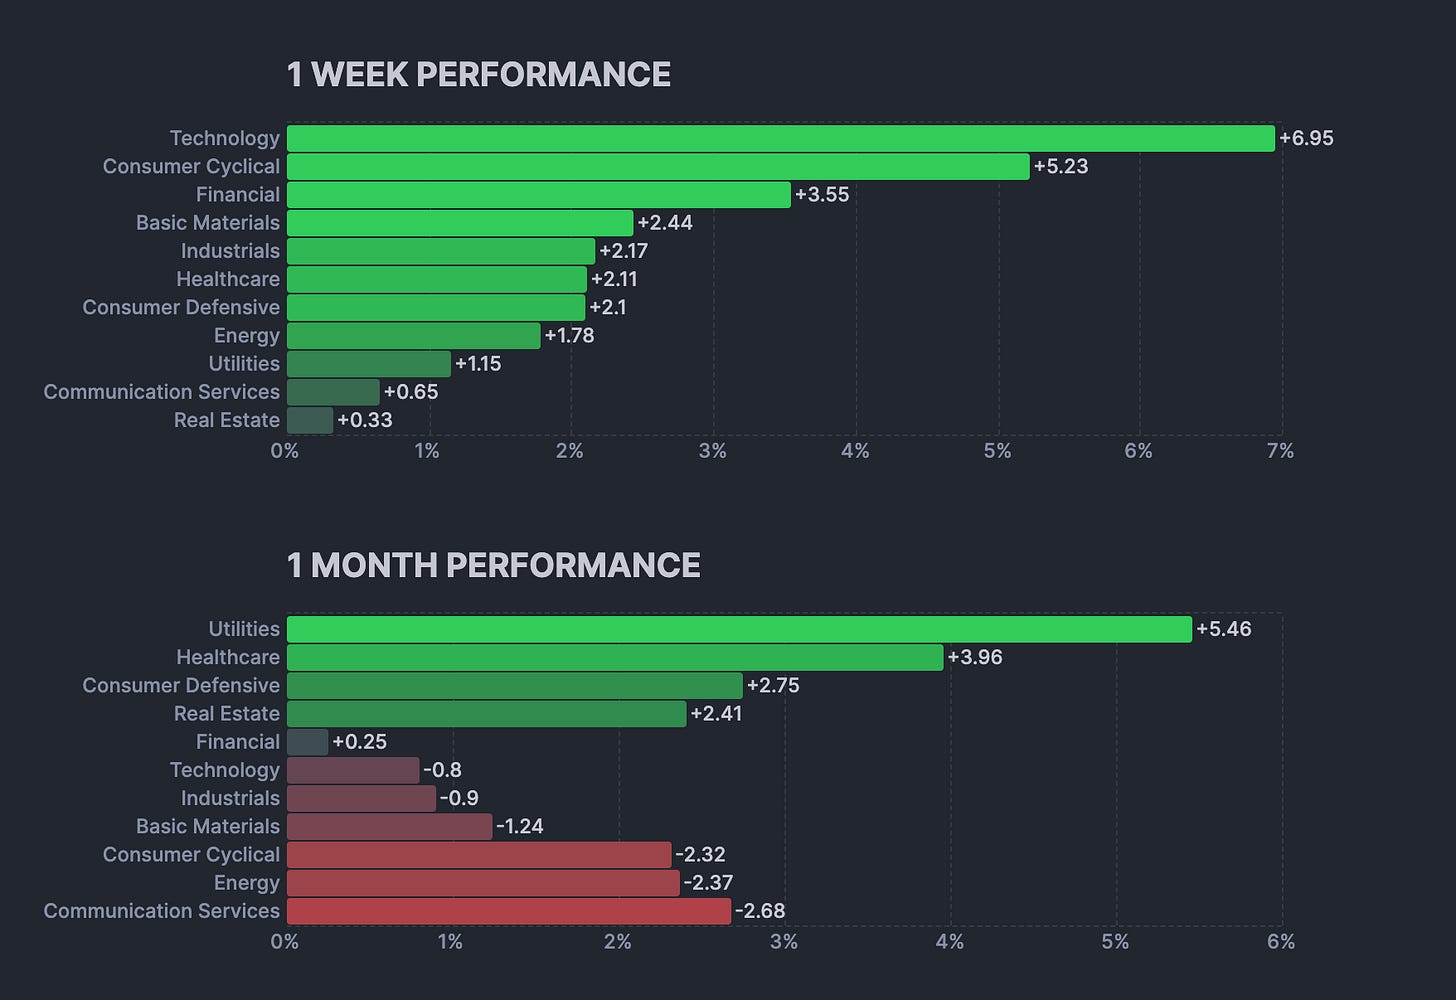
Sector Performance
Looking Ahead to the Upcoming Week
Looking ahead to next week, investors will focus on S&P Global’s Purchasing Managers’ Indexes (PMIs) for manufacturing and services, Federal Reserve (Fed) Chair Jerome Powell’s speech at the Jackson Hole Symposium, and the minutes from the Fed’s most recent policy meeting. Additionally, the Leading Economic Index, as well as new and existing home sales, will be closely watched.
Economic Events
Earnings Event
Markets
Below are the levels for the upcoming week - updates will be provided on X (previously Twitter) throughout the week.
SPY - SPDR S&P 500 ETF Trust
Bullish Case:
Short-term: The stock is showing strong bullish momentum, with the potential to break above the $555.02 level and challenge the previous high at $565.16.
Medium-term: If the price breaks and sustains above $565.16, this could confirm the continuation of the bullish trend, potentially leading to new highs.
Long-term: Sustained momentum above $565.16 would suggest a strong long-term bullish trend, possibly targeting even higher levels.
Bearish Case:
Short-term: Failure to break above $555.02 could lead to a pullback towards $533.07 or even lower, particularly if broader market conditions weaken.
Medium-term: If the price fails to sustain above $555.02 and reverses, it could indicate a potential double-top formation, leading to a more significant correction.
Long-term: Continued failure to break above key resistance levels could lead to further downside pressure, especially if market sentiment shifts.
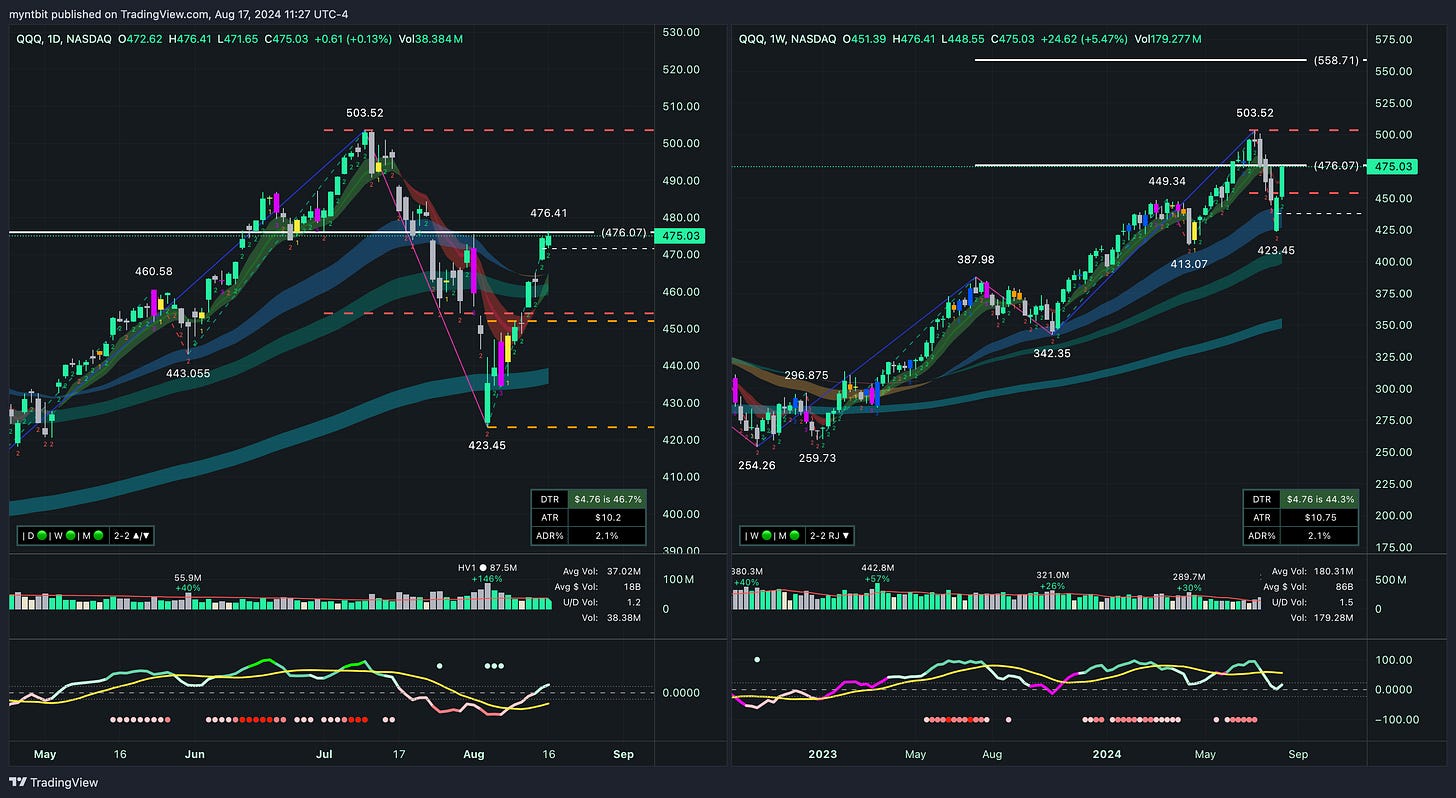
QQQ - Invesco QQQ Trust Series 1
Bullish Case:
Short-term: If QQQ breaks above the $476.07 resistance level, there is a good chance it will challenge the previous high of $503.52.
Medium-term: Sustained momentum above $476.07 would indicate a continuation of the uptrend, potentially leading to new highs.
Long-term: The long-term trend remains bullish, but breaking $503.52 is crucial for further significant gains.
Bearish Case:
Short-term: Failure to break above $476.07 could lead to a pullback towards $460.58 or lower, especially if broader market conditions weaken.
Medium-term: If the price fails to sustain above $476.07 and reverses, it could lead to a more significant correction back towards $443.055 or even lower.
Long-term: If QQQ cannot recover from any potential pullback, it might enter a longer-term consolidation phase.
IWM - iShares Russell 2000 ETF
Bullish Case:
Short-term: A breakout above $213.98 could push the price towards $228.63.
Medium-term: If IWM can sustain momentum above $213.98, it might aim for the $228.63 high, and potentially higher.
Long-term: The longer-term uptrend remains intact, and breaking above $228.63 could lead to further gains towards $241.55.
Bearish Case:
Short-term: Failure to break $213.98 could result in a pullback towards $209.77 or lower, especially if market sentiment weakens.
Medium-term: A move below $196.7 could indicate a deeper correction, possibly testing lower support levels.
Long-term: If the $196.7 support fails, it could lead to a more prolonged downturn, challenging the bullish momentum.
DIA - SPDR Dow Jones Industrial Average ETF Trust
Bullish Case:
Short-term: A breakout above $407.37 could drive the price toward $413.86, with the potential to extend to $435.37.
Medium-term: Sustaining momentum above $407.37 could lead to a continuation of the uptrend, targeting $413.86 and potentially higher.
Long-term: The longer-term outlook remains bullish as long as key support levels hold. A break above $413.86 could set the stage for new highs.
Bearish Case:
Short-term: Failure to break $407.37 could result in a pullback to $398.08 or lower, especially if market sentiment weakens.
Medium-term: A move below $392.53 could indicate a deeper correction, possibly testing the $384.93 support level.
Long-term: If the $384.93 support fails, it could lead to a more prolonged downturn, challenging the overall bullish momentum.
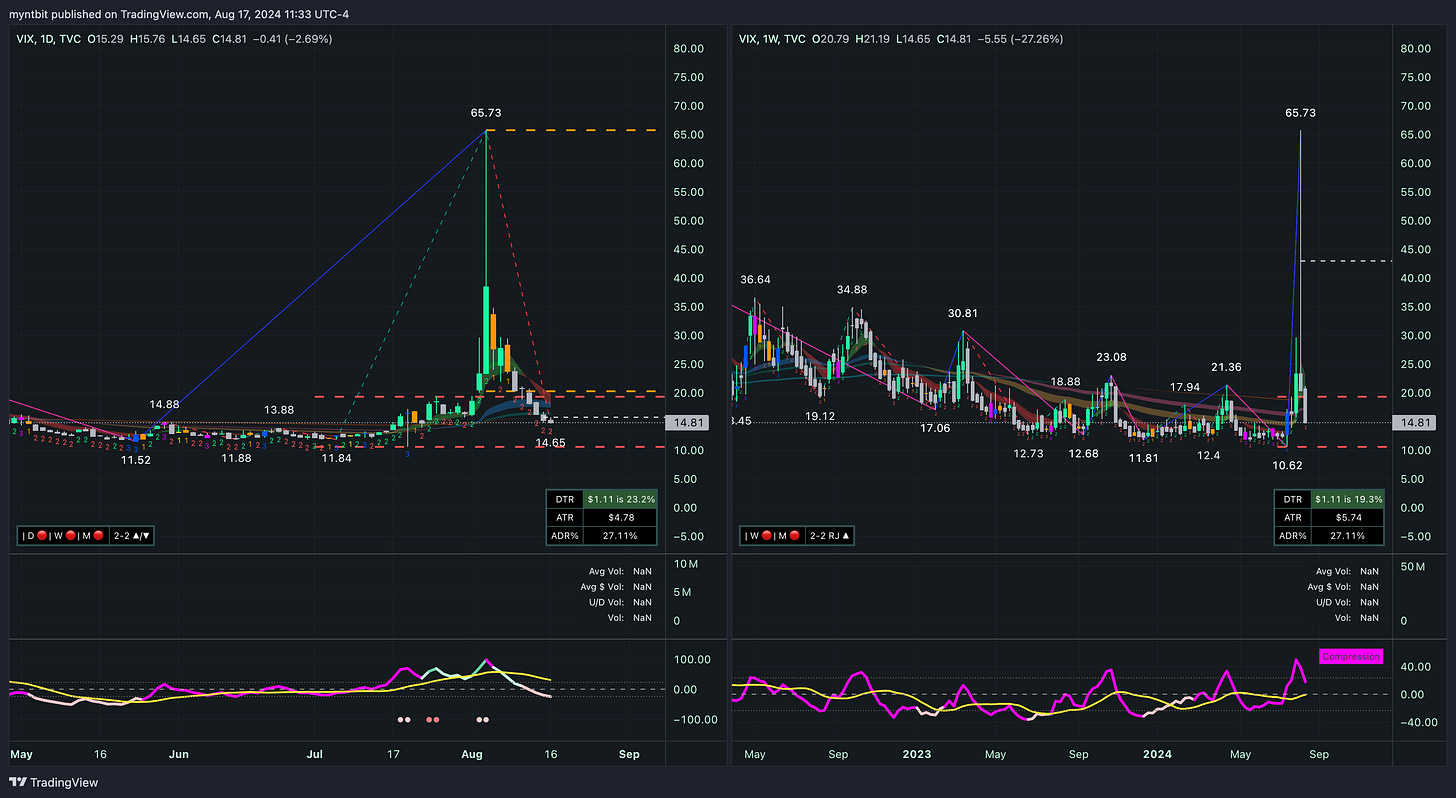
VIX - Volatility S&P 500 Index
Bullish Case:
Short-term: If the VIX holds above 14.65 and bounces, there could be a move back toward the 21.36 and 23.08 resistance levels.
Medium-term: A sustained increase in market volatility could see the VIX testing higher levels, potentially returning to the 30 range.
Long-term: The long-term outlook for VIX depends on broader market conditions. If market uncertainty increases, VIX could see higher levels sustained.
Bearish Case:
Short-term: A break below 14.65 could lead to a further decline, possibly testing the lows around 11.52.
Medium-term: Continued low market volatility could see VIX consolidating at these lower levels, with little upward movement.
Long-term: If the market remains stable, VIX may continue to decline, potentially moving towards the lows seen earlier in the year.
Last Week's Watchlist
PYPL - PayPal Holdings
PYPL hit the upside target. Will be removed from the list.
ENPH - Enphase Energy
ENPH broke upside but is yet to hit the upside target.
Bullish Case:
Short-term: A hold above $107.86 could lead to a bounce towards $122.95. However, a strong close above this resistance is needed to confirm a bullish reversal.
Medium-term: If $122.95 is broken, the next target could be around $125.00, with potential for further gains if market sentiment improves.
Long-term: Stabilization above $96.78 could provide a foundation for a gradual recovery, but breaking the series of lower highs is essential for a sustained bullish trend.
Bearish Case:
Short-term: The "Shooter" pattern suggests that the price could test $96.78 again. A break below this level would likely target $88.80.
Medium-term: Continued weakness below $96.78 could see the stock decline towards $88.80 and possibly lower, depending on broader market conditions.
Long-term: If the bearish trend continues, the stock could remain under pressure, especially if it fails to hold key support levels.
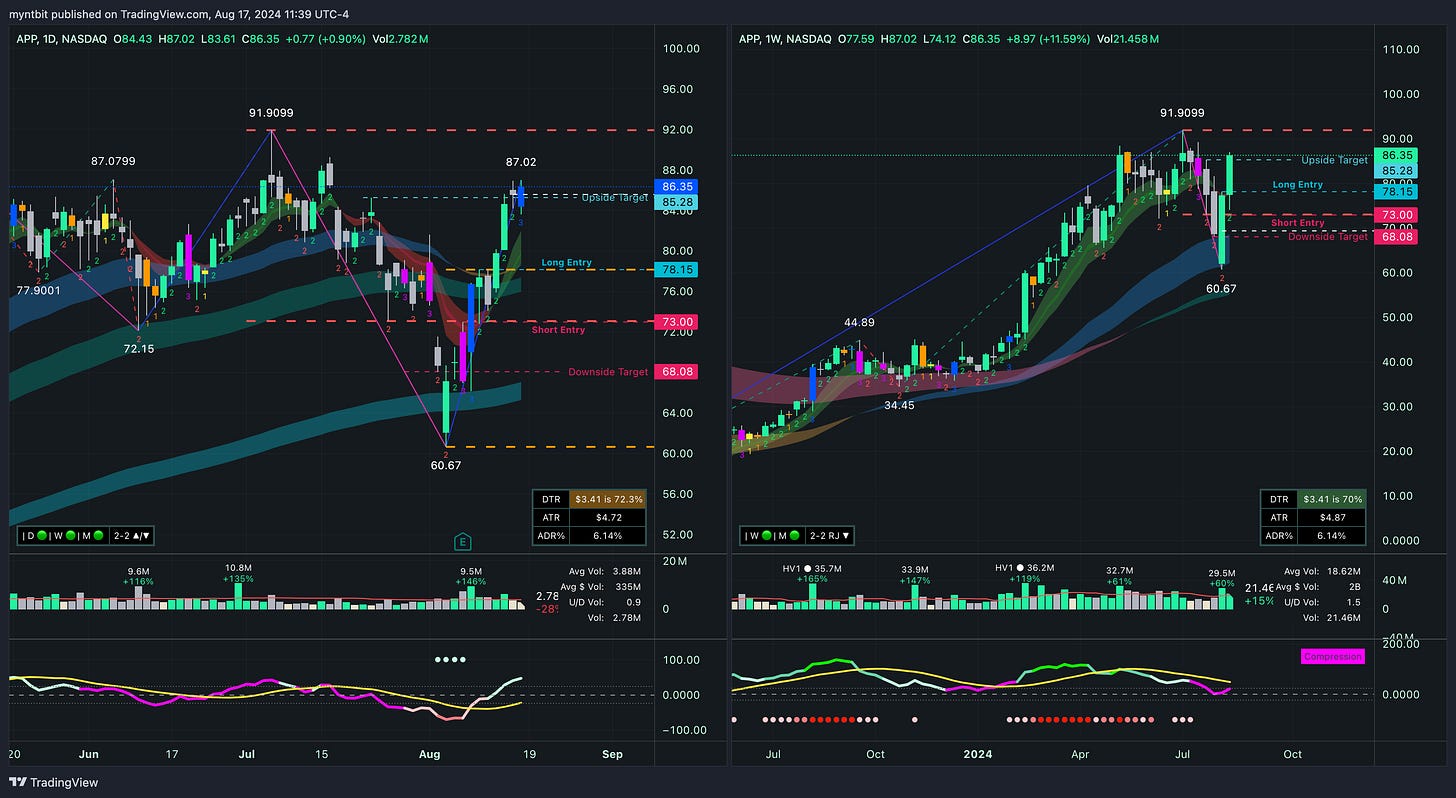
APP - Applovin Corp
APP hit the upside target. Will be removed from the list.
Stock Watchlist for the Upcoming Week
MSTR - MicroStrategy Inc. (Freebie)
Bullish Case:
Short-term: If MSTR holds above $126.59 and breaks above $140.00, it could target $159.14. A sustained move above $140 would be the first sign of a potential trend reversal.
Medium-term: Continued strength could push the stock towards $159.14 and potentially higher, but this would require strong buying interest and a broader market rally.
Bearish Case:
Short-term: A break below $126.59 could lead to a retest of $120.00, and further weakness could see the stock testing $113.20 and even the low of $102.40.
Medium-term: Sustained weakness could see the stock continue its downtrend, especially if the broader market faces headwinds.
Options Opportunity
Put Option: Consider a put option if MSTR breaks below $126.59, targeting the $120.00 or $113.20 levels.
Call Option: If the stock shows strength and breaks above $140.00, a call option targeting $159.14 could be considered, although this is higher risk given the current market conditions.
Keep reading with a 7-day free trial
Subscribe to BitResearch by MyntBit to keep reading this post and get 7 days of free access to the full post archives.


