

Market at Crossroads | Powell, PCE, and NVIDIA in the Spotlight – Week of May 25
Dive into the market analysis for the upcoming week of May 25, 2025 and the week’s key economic data. Stay ahead with expert insights and forecasts.

Market Report
Stocks pulled back this week, breaking a multi-session win streak as rising long-term Treasury yields, deficit concerns, and escalating tariff threats from President Trump rattled market sentiment. After a strong recovery off the April 7 lows, the market entered a choppy consolidation phase driven by macro overhangs and policy uncertainty.
Index Performance
S&P 500: Fell -1.3% for the week, snapping its six-week advance.
Nasdaq Composite: Declined -1.7%, led lower by mega-cap tech names.
Dow Jones Industrial Average: Dropped -1.2%, reversing early-week gains.
Russell 2000: Lagged, falling -2.4%, reflecting continued weakness in small caps.
Markets closed just off weekly lows, driven by defensive positioning ahead of the Memorial Day weekend.
Market Drivers & Themes
Rising Yields & Moody’s Downgrade
Moody’s downgraded the U.S. credit rating to Aa from Aaa on Monday, citing worsening debt metrics.
This triggered a sharp rise in the 10-year yield, peaking at 4.63% before settling at 4.51%, up +7 bps for the week.
The 30-year yield jumped to 5.15% intraday before closing at 5.04%.
Trump’s Trade Tariff Escalation
President Trump spooked markets Friday by threatening a 25% tariff on Apple iPhones not made in the U.S.
He also proposed a 50% tariff on EU goods starting June 1, citing stalled trade talks.
Markets saw a brief flight to safety as the VIX surged to 25.53 before easing to 21.92 by close.
Reconciliation Bill Passed
The House narrowly passed a $4T reconciliation bill, lifting SALT caps and advancing Medicaid reform.
The bill is estimated to add $3.3T to the deficit over 10 years, raising fiscal sustainability concerns.
Treasury auctions were poorly received midweek, with weak demand in the 20-year auction exacerbating the selloff in bonds.
Economic Data Highlights
Jobless Claims: Initial claims steady at 227K; continuing claims rose to 1.903M.
Existing Home Sales: Fell to 4.00M annualized rate — slowest for April since 2009.
New Home Sales: Jumped +10.9% in April to 743K, helped by a drop in median prices.
PMIs: Manufacturing and Services both printed 52.3, signaling modest expansion.
Leading Economic Index: Fell -1.0% in April, deeper than expected.
Sector Performance
Defensive sectors outperformed: Utilities (+1.2%), Consumer Staples (-0.4%), Health Care (-0.6%).
Cyclicals & Tech lagged: Info Tech (-1.3%), Communication Services (-1.0%), Consumer Discretionary (-0.9%).
Energy and Financials also declined as rising rates pressured valuations and growth concerns lingered.
Notable Stock Highlights
Apple (AAPL) dropped -3.0% on tariff threats targeting overseas production.
Alphabet (GOOG) gained +2.9% midweek on AI optimism following its I/O developer event.
NVIDIA (NVDA) continued to rise, up +0.8% post-earnings and guided optimism.
Snowflake (SNOW) surged +13.4% after reporting strong earnings and forward guidance.
UnitedHealth (UNH) tumbled -5.8% following a downgrade and negative press despite DOJ clearance.
Technical & Macro Outlook
The market is entering a structural inflection point. Short-term trends are weakening, breadth is narrowing, and volatility is climbing. With mega-cap tech under pressure and yields rising, traders should tighten risk and favor relative strength names.
Watch VIX, now elevated, for clues on short-term volatility.
Breadth deterioration and sector rotation into defensive names signal caution.
Fiscal and trade policy headlines are dominating market direction — stay agile.
Takeaway
While the market hasn’t fully broken down, this week marks a notable shift in tone. With macro risks resurfacing — from credit rating downgrades to tariff escalation — the path forward is less clear. Expect chop, headline sensitivity, and increased volatility. This is a week to reduce risk, remain defensive, and prepare for a potentially volatile June.
Weekly Market Heatmap

Weekly Sector Performance

Market Triangle

⦿ Trend → Breaking Down
The trend structure is decisively weakening. The 5-day trend remains red, and now the 20-day trend has lost momentum, showing early signs of reversal. The 50-day trend is still barely holding green but has begun to fade. The 200-day trend remains firmly negative, underscoring a longer-term bearish backdrop. With short- and medium-term trends rolling over, alignment is broken — a technical warning sign.
Short-term (5D) → Negative
Medium-term (20D & 50D) → Weakening
Long-term (200D) → Still Negative
⦿ Breadth → Contracting
Breadth has taken a turn for the worse. The 4% Week signal has flipped red, confirming that fewer stocks are making significant short-term gains. The 52-week New High/Low (NHL) also remains negative, highlighting weak breakout participation. Only the 25% Quarter reading remains positive — but increasingly isolated. This breakdown in participation reflects growing fragility in market leadership.
4% Week → Negative
25% Quarter → Positive
52w New High/Low (NHL) → Negative
⦿ Momentum → Breaking Down
Momentum has decisively turned lower. Velocity (VELO) has now flipped red, reflecting a stall in price movement. Delta remains negative, confirming weakening acceleration. The VIX is red as well, pointing to rising volatility expectations and elevated market stress. This combination represents a sharp shift from bullish momentum to risk-off conditions.
Velocity (VELO) → Negative
Delta (Δ) → Negative
Volatility (VIX) → Rising
The technical backdrop has deteriorated across all three dimensions. Trends are fractured, momentum is breaking down, and breadth is now contracting — all while volatility rises. This is no longer just a pause — it’s a breakdown in structure. Caution is warranted. Limit exposure, protect capital, and stay defensive until alignment improves. This environment favors short setups, cash, or hedged positions over aggressive long trades.This is one of the strongest market structures seen in recent weeks: price trends are aligned, breadth is expanding, and momentum is firming. While long-term trend confirmation still lags, the current setup favors selective long exposure and position building in high-quality names. Stay disciplined, manage risk, but lean into strength while the market structure holds.

Broader Market Analysis

Defensive rotation is in full effect. Utilities and Staples are outperforming, while growth sectors retreat — a typical late-cycle signal or correction behavior.
Mega-cap weakness (seen via XLK and XLY) remains a drag on broader indices, especially as volatility picks up and yield pressure continues.
Momentum breadth is narrowing. Fewer sectors are showing consistent strength, increasing the risk of downside follow-through if volatility persists.
Watch for potential failed bounces. Even though major ETFs remain above the 200-day SMA, failure to hold the 50-day averages could accelerate downside momentum.


All four major U.S. equity ETFs — SPY, QQQ, IWM, and MDY — faced short-term weakness this week after a strong rebound off April lows. SPY and QQQ, which had led the rally with clean trend structures and strong volume support, are now showing early signs of fatigue near supply zones, with both printing lower highs and modest pullbacks. MDY and IWM, which had been lagging, failed to follow through on recent strength — MDY stalled below prior resistance while IWM was rejected sharply and now sits back near support levels. Volume declined across the board, and reversal candles coupled with overhead resistance suggest sellers are gaining some control. While the longer-term recovery remains intact, momentum is cooling, and leadership is thinning — especially in small- and mid-caps. This shift suggests a market in consolidation, where selectivity and risk management are increasingly critical.
Alpha List
The Alpha List is our free, high-quality watchlist highlighting stocks with breakout potential and strong technical momentum. Curated nightly using our proprietary model, it’s the first step in identifying elite opportunities.
→ View Today’s Alpha List (Free)

Looking Ahead to the Upcoming Week
The week ahead (May 25–31) is packed with high-impact events that could drive volatility in equities, bonds, and currencies, particularly in the back half of the week as several key economic indicators and Fed communications are on deck.
Sunday, May 25
2:40 PM ET: Fed Chair Powell Speaks — A closely monitored appearance. Markets will be tuned in for any signals on inflation, rate path, or policy tightening bias.
Tuesday, May 27
8:30 AM ET: Core Durable Goods Orders m/m — Forecast: -0.1% (Prior: -0.4%). A surprise positive read would signal underlying business investment strength.
8:30 AM ET: Durable Goods Orders m/m — Forecast: -7.9% (Prior: +7.5%). Volatile data, but sharp decline may raise concerns about demand slowdown.
10:00 AM ET: CB Consumer Confidence — Forecast: 87.1 (Prior: 86.0). Any sharp deviation could affect consumer-sensitive sectors.
10:10 PM ET: FOMC Member Waller Speaks — Known for direct tone. Watch for clues on rate path or balance sheet outlook.
Wednesday, May 28
10:00 AM ET: Richmond Manufacturing Index — Forecast: -9 (Prior: -13). A continued negative print will reinforce concerns over regional manufacturing weakness.
2:00 PM ET: FOMC Meeting Minutes — High impact. Market participants will parse every line for clarity on future rate moves and internal Fed debate on inflation risks.
Thursday, May 29
8:30 AM ET:
Prelim GDP q/q — Forecast: -0.3% (Prior: -0.3%). Confirmation of a flat or negative GDP could renew hard landing fears.
Unemployment Claims — Forecast: 229K (Prior: 227K). A key labor trend to monitor.
Prelim GDP Price Index q/q — Forecast: 3.7% (Prior: 3.7%). A surprise here could move inflation-sensitive sectors.
10:00 AM ET: Pending Home Sales m/m — Forecast: -1.0% (Prior: +6.1%). May reflect ongoing housing affordability pressure from elevated mortgage rates.
Friday, May 30
8:30 AM ET: Core PCE Price Index m/m — Forecast: +0.1% (Prior: +0.0%). The Fed’s preferred inflation gauge. Even a small beat could shift rate expectations.
10:00 AM ET: Revised UoM Consumer Sentiment — Forecast: 51.1 (Prior: 50.8). Watch for shifts in inflation expectations embedded in this report.
📌 Takeaway:
A busy week with Powell, GDP, Core PCE, and FOMC minutes dominating the spotlight. Thursday and Friday are stacked with critical macro data that will heavily influence the Fed narrative and market risk appetite. Traders should brace for sharp moves, especially if data misses or surprises consensus expectations.

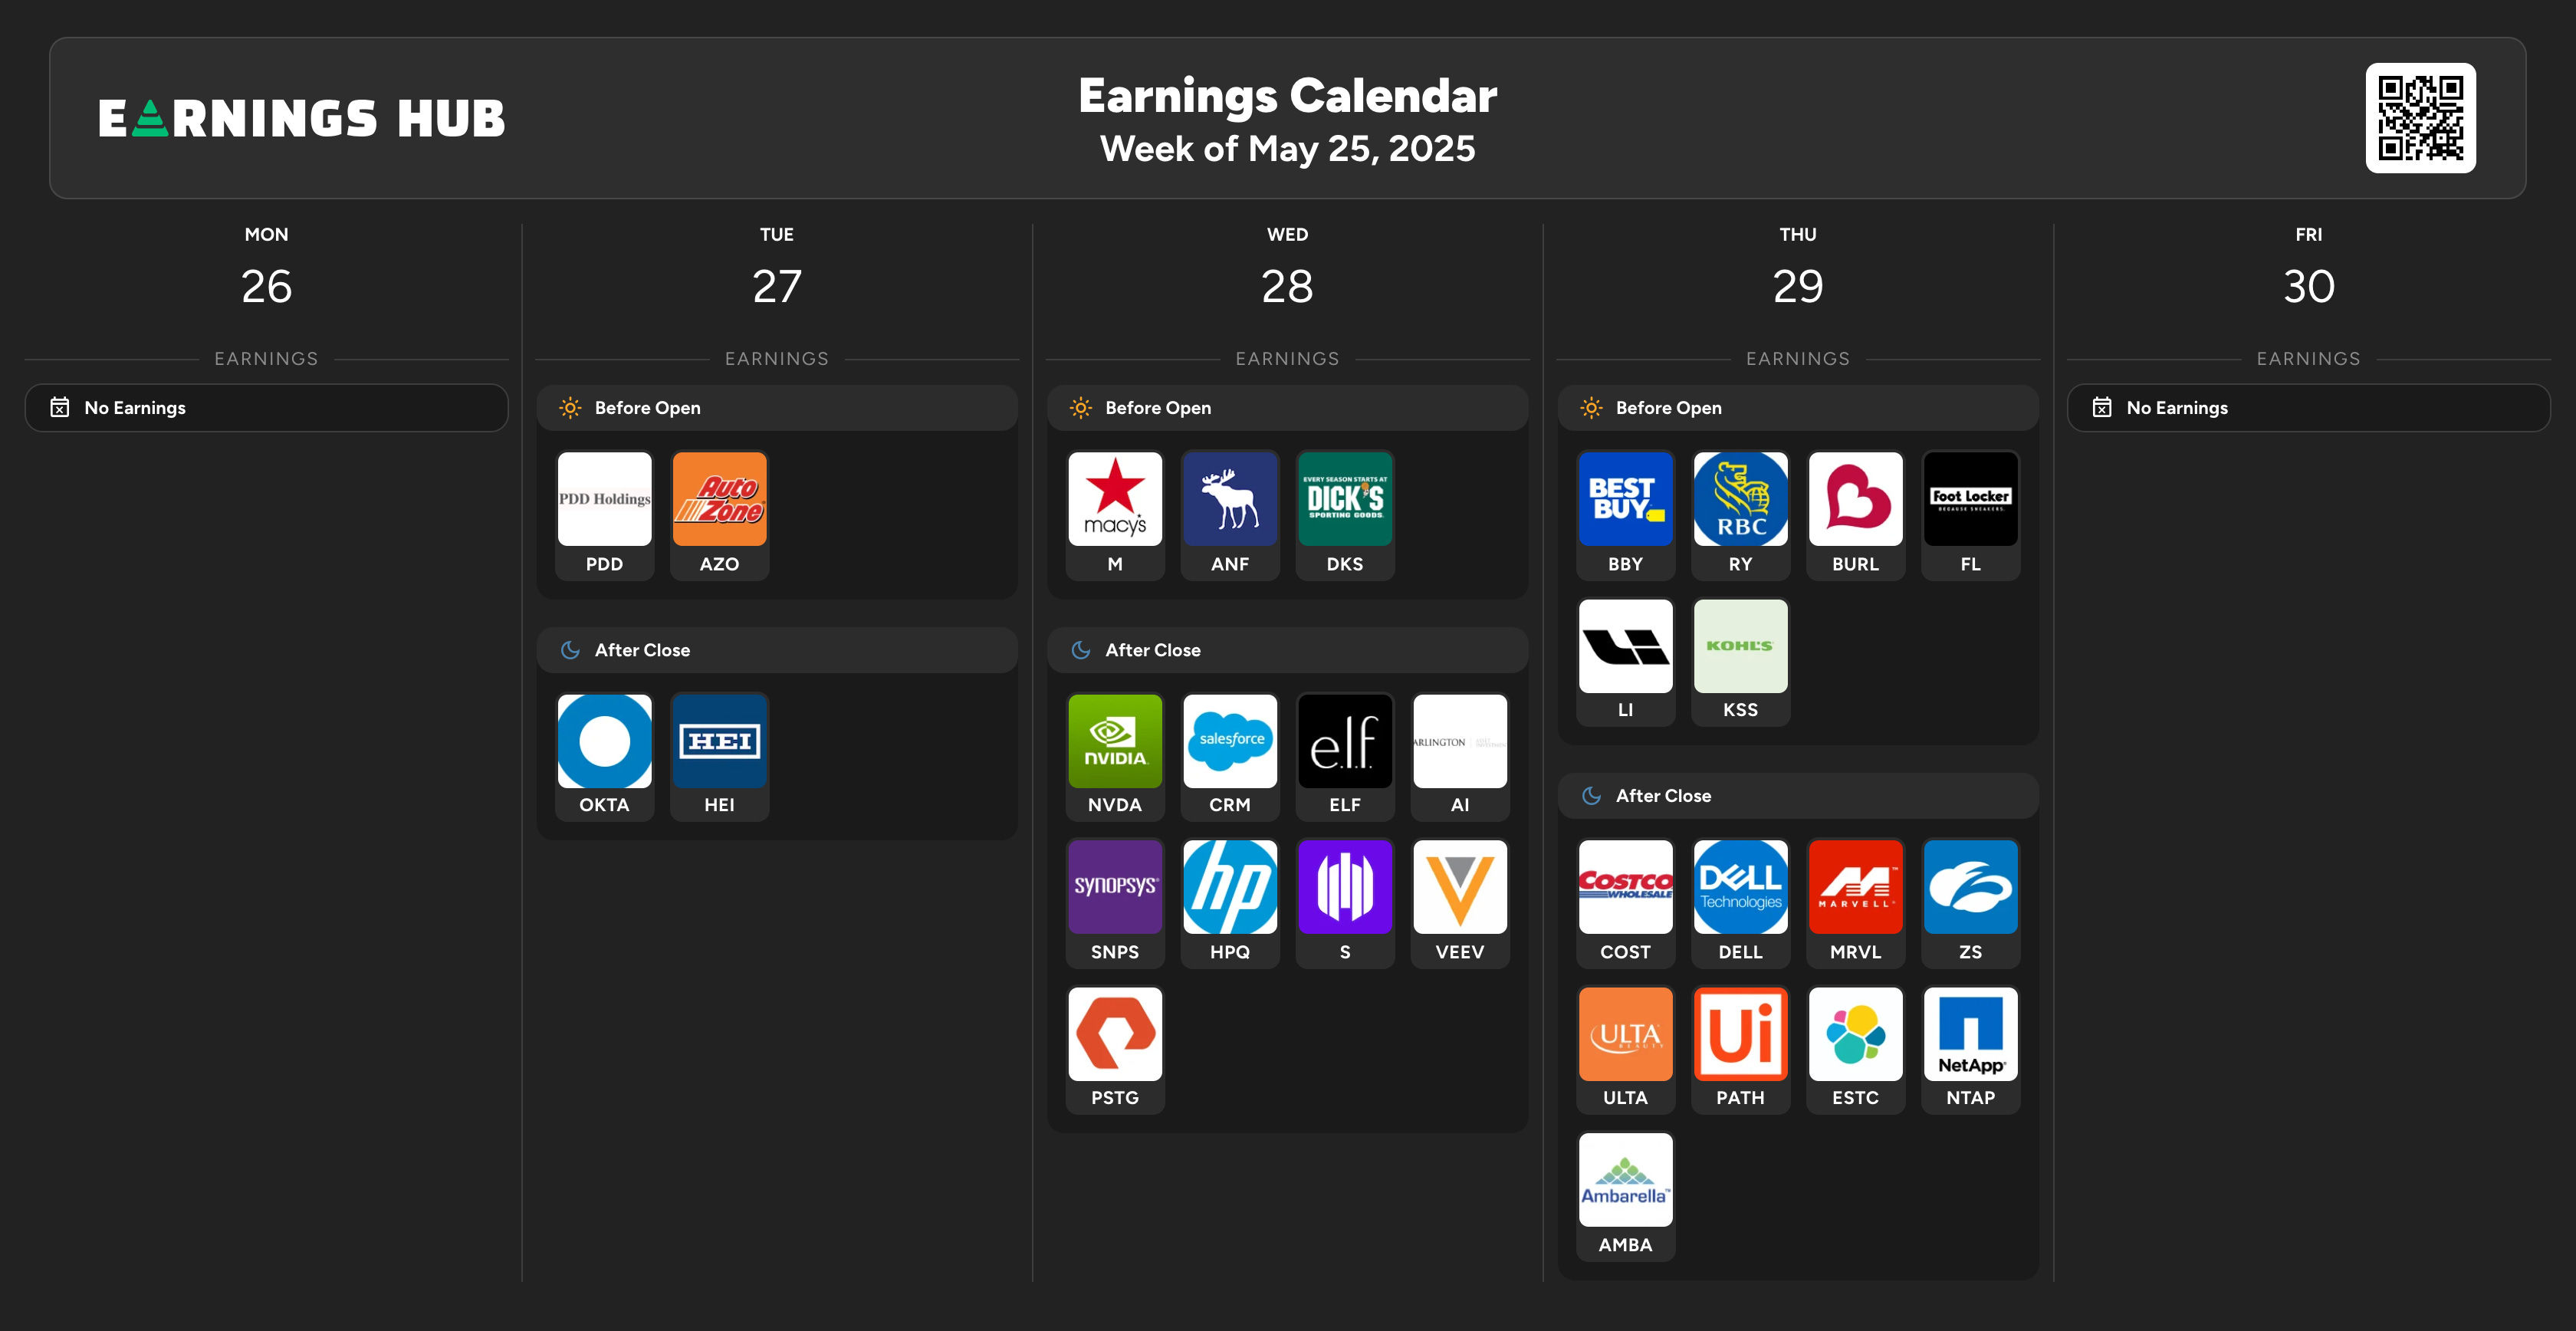
Earnings Highlights:
A heavy earnings week is ahead with major reports from retail, tech, and semiconductors. These results could shift sentiment across growth sectors and provide clarity on consumer health and enterprise demand.
Tech takes center stage midweek with NVIDIA, Salesforce, and HP reporting, alongside retail names like Macy’s, Best Buy, and Costco — giving a full picture of consumer trends and enterprise IT demand. Watch NVIDIA and Marvell closely for semiconductor momentum, and keep an eye on Ulta and Foot Locker for discretionary spending sentiment. Volatility risk is elevated around Wednesday–Thursday’s after-hours sessions.
Disclaimer: This newsletter is not trading or investment advice, but for general informational purposes only. This newsletter represents our personal opinions that we share publicly for educational purposes. Futures, stocks, and bonds trading of any kind involves a lot of risks. No guarantee of any profit whatsoever is made. In fact, you may lose everything you have. So be very careful. We guarantee no profit whatsoever, You assume the entire cost and risk of any trading or investing activities you choose to undertake. You are solely responsible for making your own investment decisions. Owners/authors of this newsletter, its representatives, its principals, its moderators, and its members, are NOT registered as securities broker-dealers or investment advisors either with the U.S. Securities and Exchange Commission, CFTC, or with any other securities/regulatory authority. Consult with a registered investment advisor, broker-dealer, and/or financial advisor. By reading and using this newsletter or any of my publications, you are agreeing to these terms. Any screenshots used here are courtesy of ForexFactory, EarningsHub, Finviz, ThinkorSwim, and/or Tradingview. We are just end-users with no affiliations with them.
Ready to Trade Smarter? Join BitResearch Premium
BitResearch isn’t just a stock alert service — it’s your edge in today’s market. With access to our live portfolio, you’ll receive expertly curated trade setups, complete with clear entry points, dynamic stop-losses, and two-stage profit targets.
Whether you're risk-averse or growth-focused, our menu of high-probability ideas is built to fit your strategy — all backed by a 14-factor technical model used by serious traders.
✅ Real trades. Real-time updates.
✅ BitReports with actionable insights
✅ No hype. No day trading. Just data-driven swing trades.
🎯 Start your 7-day free trial today and get instant access to the full portfolio, without obligation.
Let BitResearch simplify your trading — so you can focus on results.
Stay Connected — Follow BitResearch
Want even more insights, trade ideas, and market breakdowns?
📲 Follow us on Twitter/X
📬 Subscribe on YouTube for tutorials and portfolio updates
📣 Join our growing community of traders sharing strategies and results
At BitResearch, we’re building more than trades — we’re building smarter investors.
Thank you. Here are my Apr PCE inflation estimates for the data that goes out Friday: https://open.substack.com/pub/arkominaresearch/p/apr-2025-pce-inflation-estimate?r=1r1n6n&utm_campaign=post&utm_medium=web&showWelcomeOnShare=false