Market Triangle | 05.28.2025
A proprietary model that evaluates the current state of the market using three core components — Trend, Breadth, and Momentum.
⦿ Trend → Losing Steam
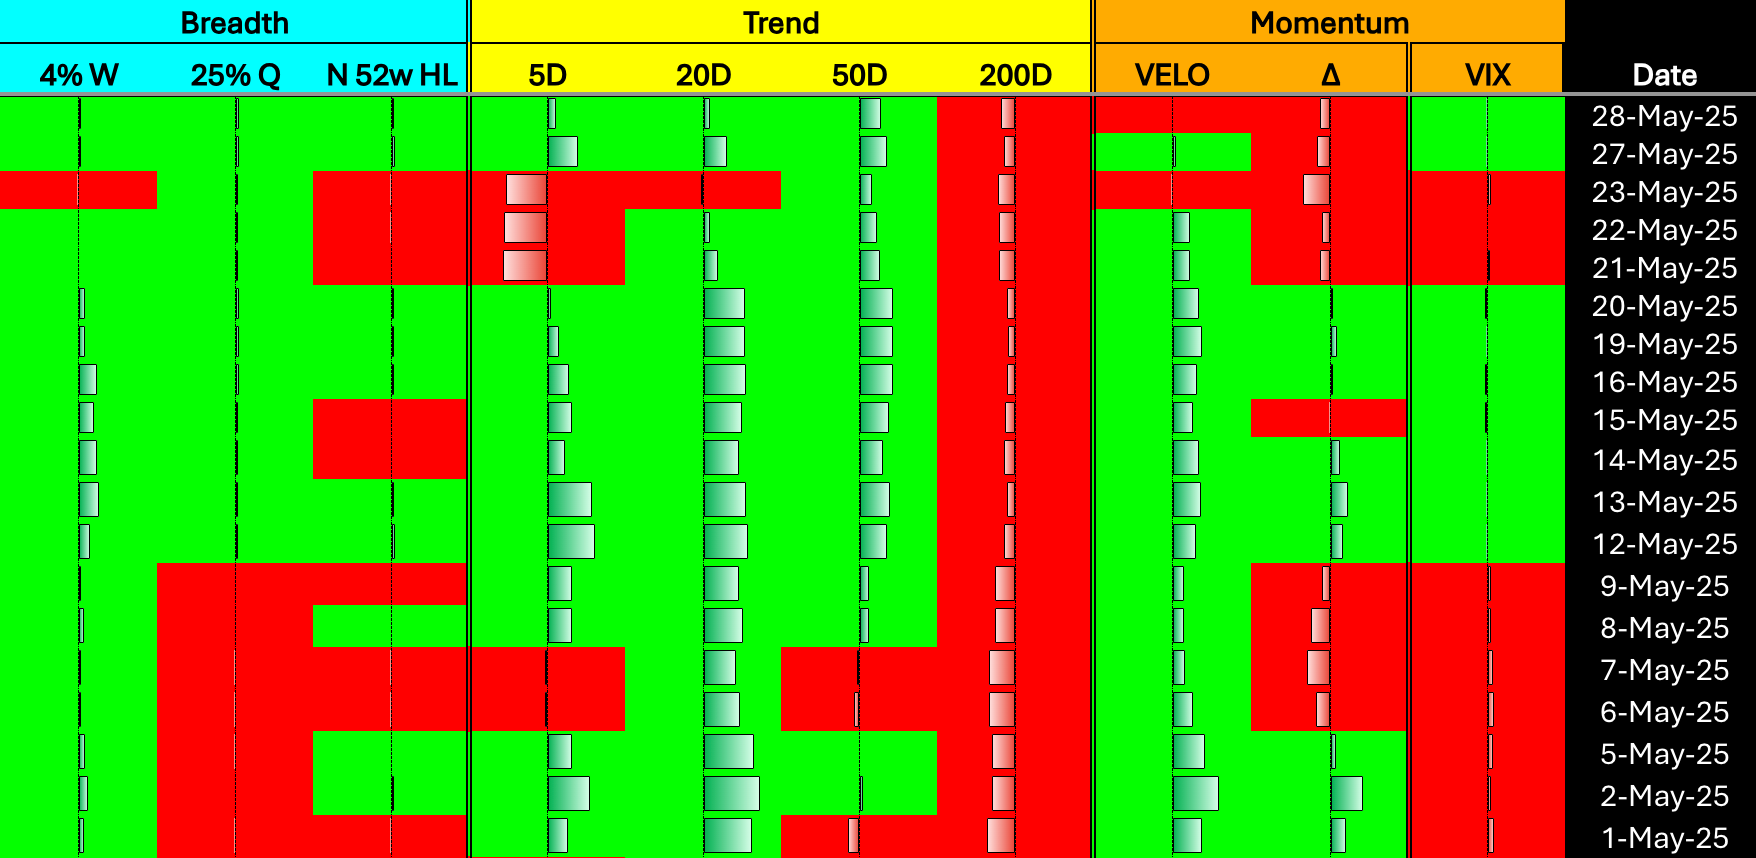
The short-term and medium-term trend structure is weakening again. The 5-day and 20-day trends have flipped red, and while the 50-day remains green, it is showing early signs of deterioration. The 200-day trend continues to stay deeply negative. This breakdown suggests the rally is stalling, and trend alignment is beginning to crack again.
Short-term (5D) → Negative
Medium-term (20D) → Negative
Medium-term (50D) → Positive but weakening
Long-term (200D) → Still Negative
⦿ Breadth → Holding Firm
Despite the trend shift, breadth remains resilient. The 4% Week, 25% Quarter, and 52-week New High/Low (NHL) indicators are all still positive, suggesting broad participation and underlying structural strength — for now.
4% Week → Positive
25% Quarter → Positive
52w New High/Low (NHL) → Positive
⦿ Momentum → Weakening
Momentum is back under pressure. Velocity (VELO) flipped red again, indicating slowing price movement. Delta (Δ) remains red and is declining, showing momentum deterioration. On a more constructive note, VIX is falling, suggesting the rise in volatility is cooling for now — a potential stabilizer.
Velocity (VELO) → Negative
Delta (Δ) → Negative and deteriorating
Volatility (VIX) → Falling
The market’s internals are once again losing coherence. While breadth remains broad and volatility is easing, the deterioration in trend and momentum warns of increasing fragility. This is no longer a clean uptrend. Traders should move with caution — favoring defensive setups, reducing exposure, and staying nimble until trend and velocity realign. The market remains split between hopeful breadth and hesitant price action.
🔍 Alpha List
The Alpha List is our free, high-quality watchlist highlighting stocks with breakout potential and strong technical momentum. Curated nightly using our proprietary model, it’s the first step in identifying elite opportunities.
→ View Today’s Alpha List (Free)
Broader Market Analysis
Broad Weekly Strength: Most sectors remain green on a 1-week basis, suggesting steady upward momentum since last week's volatility. Standouts include XLY (Consumer Discretionary) +1.53%, XLF (Financials) +0.60%, and XLK (Technology) +0.83%.
Daily Weakness Returns: Nearly all sectors closed red on the day, indicating short-term pressure. The heaviest 1-day declines were in:
IBIT (Bitcoin ETF) -2.74%
XLE (Energy) -1.27%
XLU (Utilities) -1.40%
XLB (Materials) -1.36%
Tech Leads in Relative Momentum: XLK (Technology) continues to show strength, leading in 1-month performance at +8.54% with strong VELO (12.18%) and all moving averages aligned to the upside.
Consumer Discretionary and Financials Recovering: XLY and XLF both show positive trends over multiple timeframes with healthy breadth and improving relative strength.
Healthcare and Energy Lag: XLV and XLE continue to underperform on a YTD basis at -4.45% and -5.78% respectively. VELO for XLV also flipped negative again (-3.29%), a sign of weak momentum.
Breadth & Structure Improving: Most sectors remain above their 20SMA and 200SMA. However, several (like XLV, XLU, and XLE) still struggle below the 50SMA, signaling partial recovery but not full alignment.
Small-Caps Rebound: IWM (Russell 2000) is up +1.14% on the week and +4.81% over the month, suggesting small-cap participation is broadening out.
Bitcoin ETF (IBIT) Volatile: Despite being up +10.63% in the last month, IBIT dropped sharply today (-2.74%), highlighting its high-risk nature. Still, it remains the top YTD performer at +9.79%.
Ready to Trade Smarter? Join BitResearch Premium
BitResearch isn’t just a stock alert service — it’s your edge in today’s market. With access to our live portfolio, you’ll receive expertly curated trade setups, complete with clear entry points, dynamic stop-losses, and two-stage profit targets.
Whether you're risk-averse or growth-focused, our menu of high-probability ideas is built to fit your strategy — all backed by a 14-factor technical model used by serious traders.
✅ Real trades. Real-time updates.
✅ BitReports with actionable insights
✅ No hype. No day trading. Just data-driven swing trades.
🎯 Start your 7-day free trial today and get instant access to the full portfolio, without obligation.
Let BitResearch simplify your trading — so you can focus on results.
Stay Connected — Follow BitResearch
Want even more insights, trade ideas, and market breakdowns?
📲 Follow us on Twitter/X
📬 Subscribe on YouTube for tutorials and portfolio updates
📣 Join our growing community of traders sharing strategies and results
At BitResearch, we’re building more than trades — we’re building smarter investors.


