

Market Triangle | 06.10.2025
A proprietary model that evaluates the current state of the market using three core components — Trend, Breadth, and Momentum.

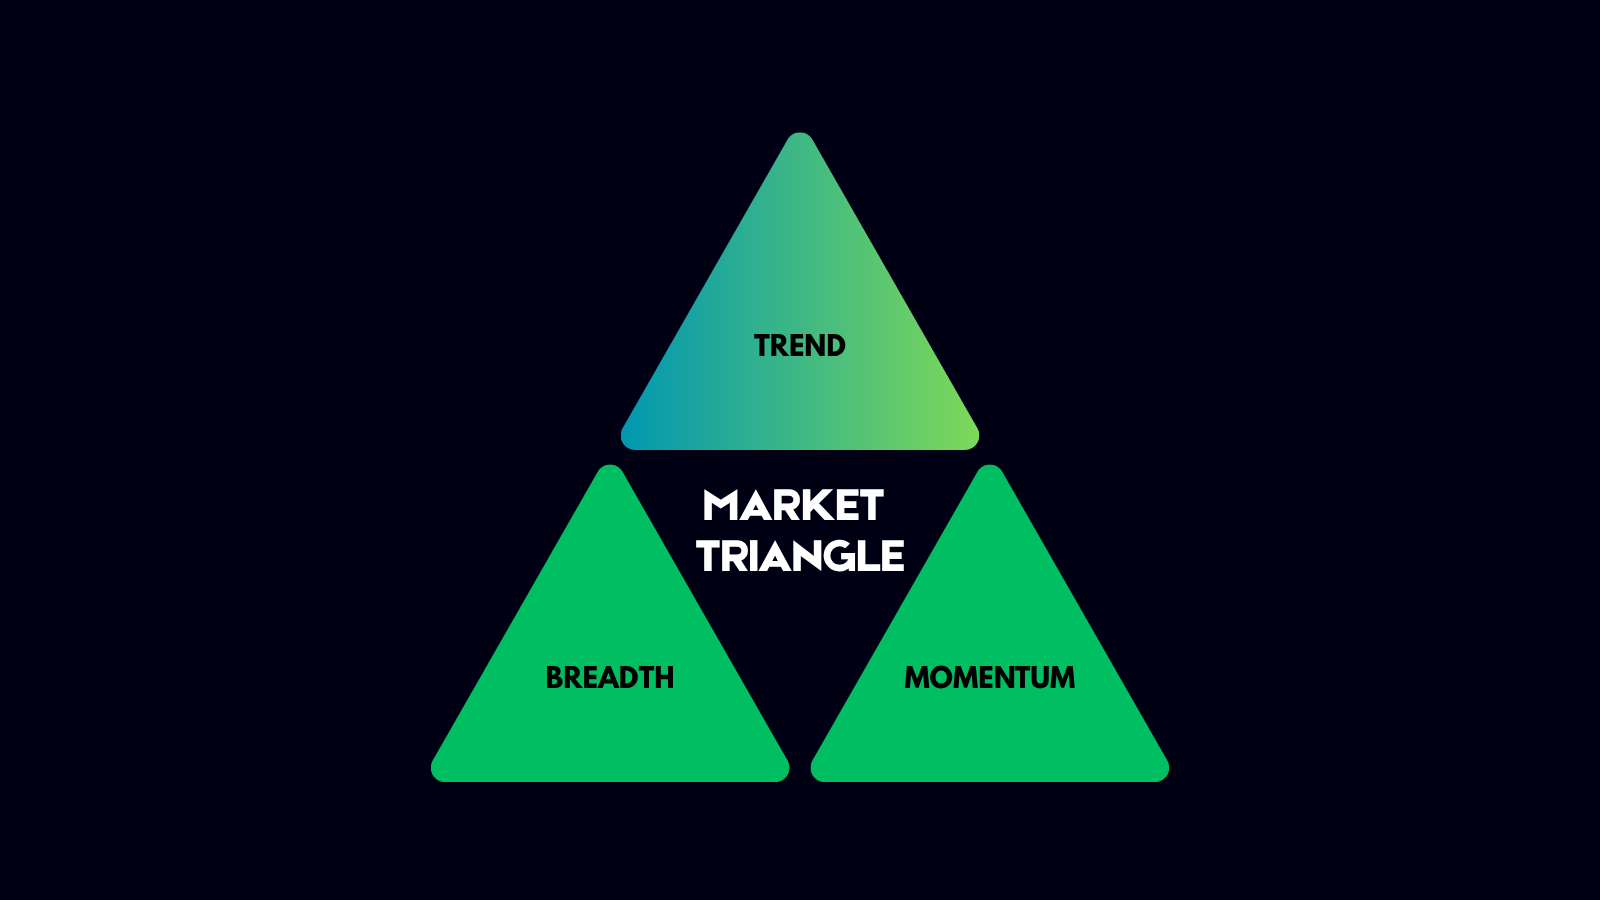
⦿ Trend → Gaining Strength
The trend structure is improving across all key timeframes. The 5-day trend has flipped green, and both the 20-day and 50-day trends remain strong, showing persistent buying pressure and sustained directionality. While the 200-day trend is still red, it’s beginning to strengthen, hinting at the early stages of a longer-term recovery.
Short-term (5D) → Positive
Medium-term (20D & 50D) → Strong and aligned
Long-term (200D) → Still Negative but improving
⦿ Breadth → Broad and Supportive
Breadth remains clearly constructive. All participation metrics — 4% Weekly Breadth, 25% Quarterly Breadth, and 52-week High/Low readings — are firmly green, showing broad market engagement. This suggests the rally is not narrow, but backed by strong internal leadership and healthy rotation.
4% Week → Positive
25% Quarter → Positive
52w New High/Low (NHL) → Positive
⦿ Momentum → Strong and Rising
Momentum has reignited. Velocity (VELO) is green, confirming stronger price action and faster movement across equities. Delta (Δ) is also rising, showing a pickup in acceleration, while VIX remains in decline, further easing volatility pressure. This marks an environment supportive of breakouts and risk-on behavior.
Velocity (VELO) → Positive
Delta (Δ) → Positive and strengthening
Volatility (VIX) → Falling
The market is shifting back into offense mode. With trend alignment improving, breadth holding firm, and momentum accelerating, conditions are turning increasingly favorable for upside continuation. While the 200-day trend still lags, it’s beginning to catch up — a potential signal that longer-term conviction is returning. Traders can lean into strength, focus on leadership sectors, and trail stops higher — but stay attentive to any sharp reversals or failed breakouts as we test new highs.


🔍 Alpha List
The Alpha List is our free, high-quality watchlist highlighting stocks with breakout potential and strong technical momentum. Curated nightly using our proprietary model, it’s the first step in identifying elite opportunities.
→ View Today’s Alpha List (Free)

Broader Market Analysis
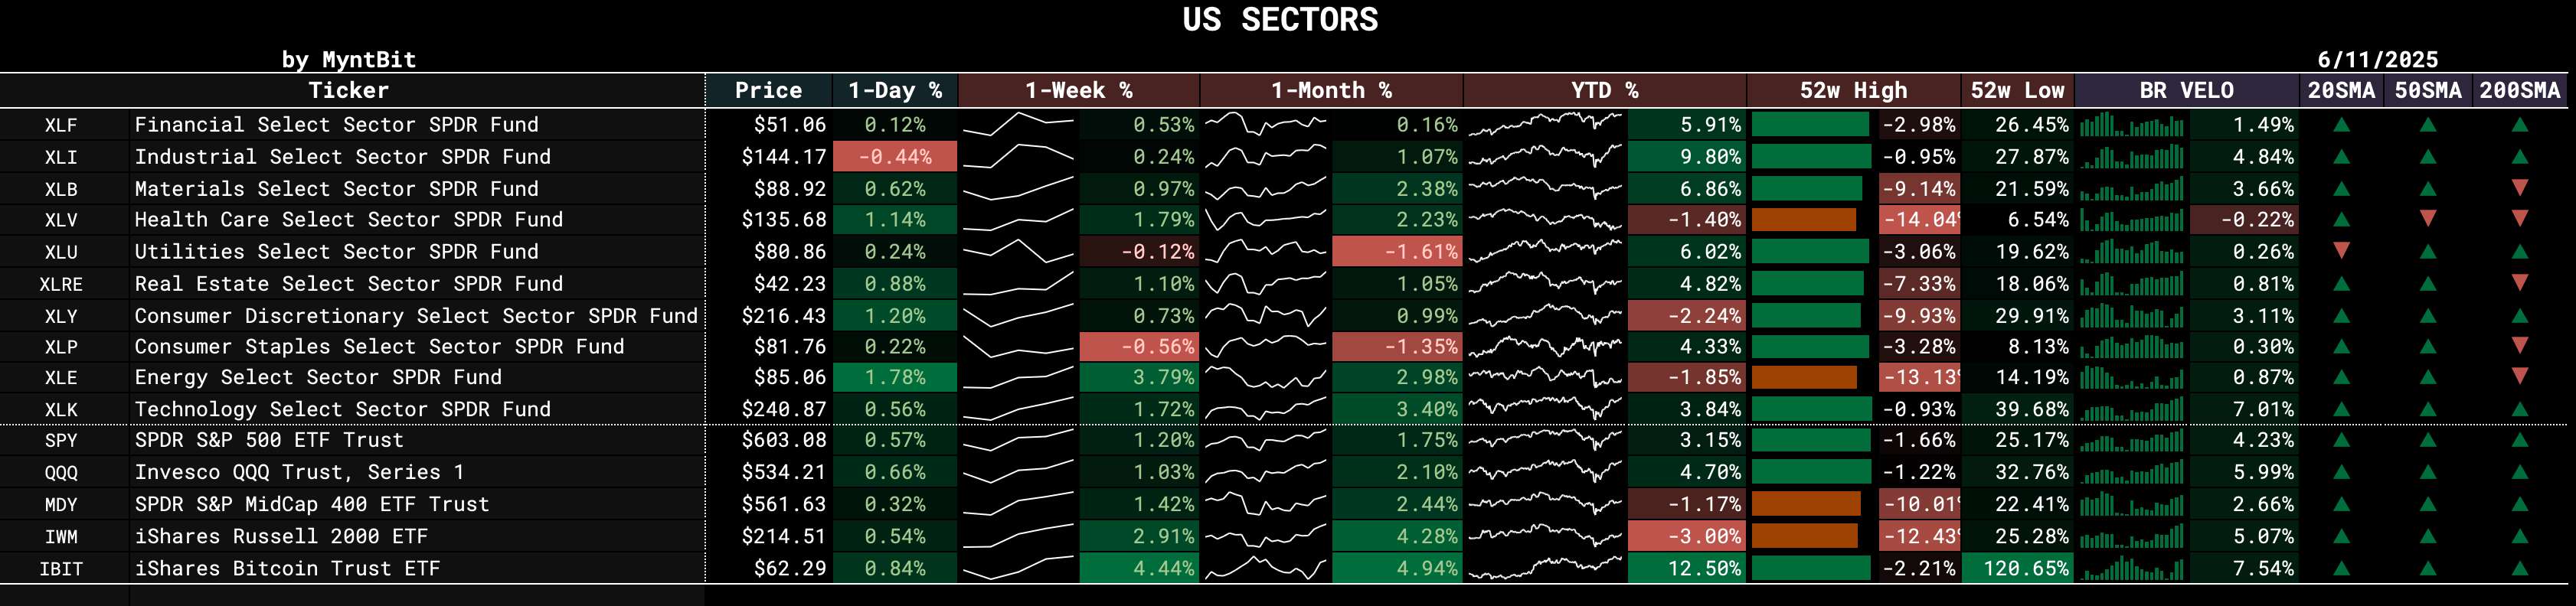
Stay overweight growth sectors (XLK, XLY, XLE) while trailing stops on extended names.
Watch IBIT for sentiment extremes — its breakout may signal broader risk-on confirmation.
Avoid chasing defensives like XLU/XLP unless they reclaim key moving averages.
Small caps (IWM) offer a tactical long opportunity with improving breadth and strong trend alignment.
Ready to Trade Smarter? Join BitResearch Premium
BitResearch isn’t just a stock alert service — it’s your edge in today’s market. With access to our live portfolio, you’ll receive expertly curated trade setups, complete with clear entry points, dynamic stop-losses, and two-stage profit targets.
Whether you're risk-averse or growth-focused, our menu of high-probability ideas is built to fit your strategy — all backed by a 14-factor technical model used by serious traders.
✅ Real trades. Real-time updates.
✅ BitReports with actionable insights
✅ No hype. No day trading. Just data-driven swing trades.
🎯 Start your 7-day free trial today and get instant access to the full portfolio, without obligation.
Let BitResearch simplify your trading — so you can focus on results.
Stay Connected — Follow BitResearch
Want even more insights, trade ideas, and market breakdowns?
📲 Follow us on Twitter/X
📬 Subscribe on YouTube for tutorials and portfolio updates
📣 Join our growing community of traders sharing strategies and results
At BitResearch, we’re building more than trades — we’re building smarter investors.